| Statistics with single list of data points each with frequency 1 | Statistics with data points from a frequency distribution |
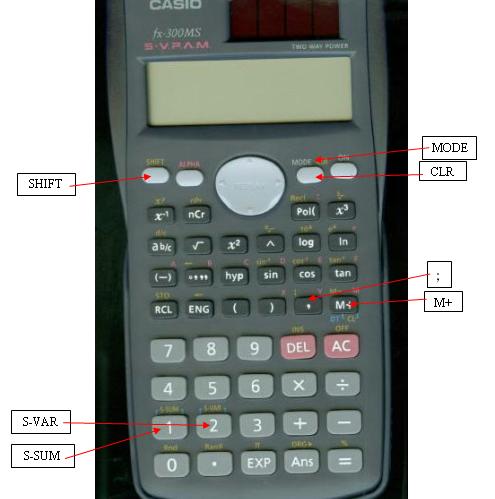
| Change to Statistics Mode: Press Clear previous data: Press Enter the data: Press first data number. Press You will see n=1. Press second data number. Press You will see n=2 Continue until you have entered all the data and have n = # where # is the total number of data points Calculating mean and standard deviation Press the Press the Press the |
Change to Statistics Mode: Press Clear previous data: Press Enter the data: Press first data number. Press Press the number in the frequency column Press You will see n=# (where # is the frequency). Press second data number. Press Press the number in the frequency column Press You will see n=# (where # is the sum of the previous numbers in the frequency column and this number). Continue until you have entered all the data and have n = # where # is the sum of the frequencies Calculating mean and standard deviation Press the Press the Press the |