Scholarly Networks on Resilience, Vulnerability and Adaptation within
the Human Dimensions of Global Environmental Change
Electronic appendix of Janssen, M.A., M.L. Schoon, W. Ke, K. Börner (2006), Scholarly networks on resilience, vulnerability and adaptation within the human dimensions of global environmental change, Global Environmental Change 16(3): 240-252
Summary
This is a background supplement of a paper that presents the results of a bibliometric analysis of the knowledge domains resilience, vulnerability and adaptation within the research activities on human dimensions of global environmental change. We analyzed how 2,286 publications over the last 30 years are related in terms of co-authorship relations and citation relations. In this supplement we presents details on data acquisition, data cleaning and analysis. We also include a copy of the database itself.
Data Collection Techniques
We selected a group of “seed” documents which we identified as the seminal literature in the fields. We conducted this selection by first identifying literature with which we were personally familiar. We also asked for suggested literature from our academic contact list, composed of key IHDP researchers, leading academics in vulnerability, resilience, and adaptability, and researchers involved with the human dimensions of global change work of the National Research Council. We then took the possible seed choices and checked the number of times each was cited between 1977 and the present using the ISI Web of Science. After our first draft circulated in January through March 2005, additional feedback was received. The same procedure is followed for keywords.
A cited reference search was then conducted on each of the seed documents using the ISI Web of Knowledge website between October 4 and 14, 2004. Based on expert feedback on a draft of the paper, additional data was downloaded between March 14 and 20, 2005. We used the Web of Science searchable index databases for Science citations, Social Science citations, and Arts and Humanities citations. Great care was taken to include all references to a single document as various editions, reference pages, and spellings are listed separately. All such references to our seed documents were then selected to generate a citation list for each document. When we used keywords, we typed the keywords in the “general search” of the Web of Science to derive a list of potential papers.
Next, the list of paper was checked, document by document, to select only publications in the area of human dimensions of environmental change. This imposes some researcher subjectivity into the process, particularly for older references which often do not have a listed abstract to guide the selection process. Great care, however, was taken to exclude book reviews and all documents not relevant to the human-nature linkage.
Once the list was cleaned to include only articles combining human activity and environmental change, the remaining items were added to a “marked” list. When viewing the marked list, the Web of Science site offers a list of information to save. We saved all information.
One seed is handled in a special way. Sen (1981) is a highly cited book in various study areas related to poverty. Also within the study of vulnerability it has been used as a major source. Due to the large number of citations of Sen (1981) in the ISI database, more than 400, of which many are not directly related to vulnerability, we decided only to include publications referring Sen (1981), when they also use the word vulnerability in the title, abstract or keywords.
Data cleaning
This information was then downloaded into a text file. We created for each of the knowledge domains a datafile with re retrieved information. All text files were downloaded into HistCite for data cleaning. We corrected the different spellings of authors’ names and merged author names spelled in different ways into one version. We also used the “Missing links” option of HistCite to correct references of the papers.
The resulting database can be found here.
Citation networks
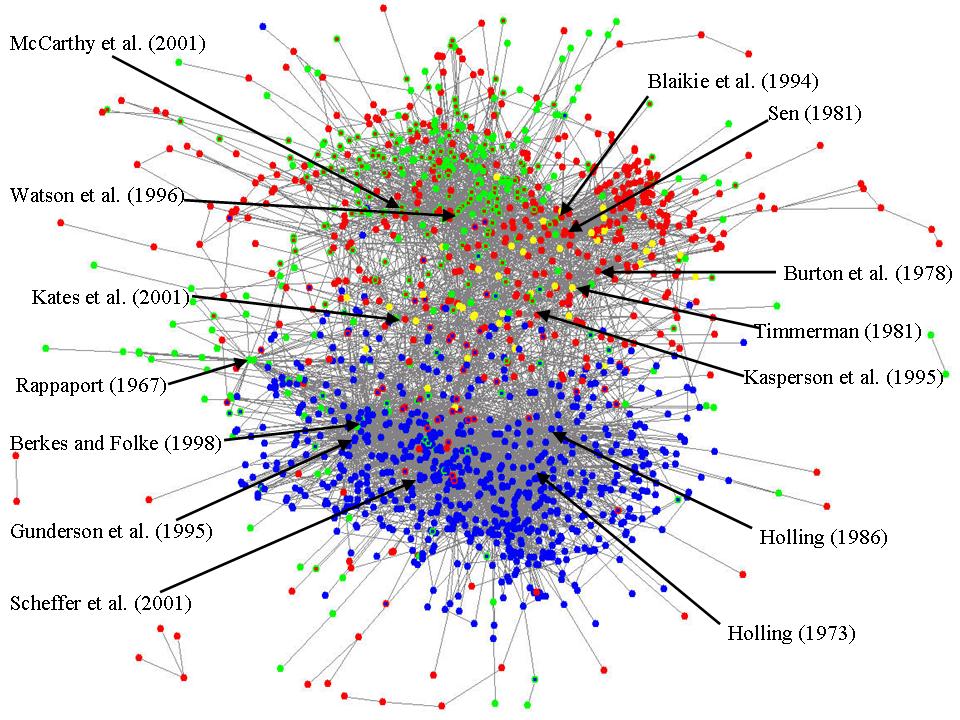
Using the cleaned data set we created citation networks with the HistCite software. We also created a figure of the whole data set by using a threshold of 0 in the number of citations. The resulting datafile was exported into Pajek. We reduced the network with those not who did not cite and were not cited, and then used the Fruchterman and Reingold algorithm to map the data points.
Paper citation network of
1956 papers. Blue refers to resilience, red to vulnerability, and green to
adaptation. When papers are within two knowledge domains, the colors of the
inner circle and the border differ. When a paper is categorized into all three
knowledge domains, it is yellow.
CoAuthorship networks
The cleaned datasets were imported into the Microsoft Access database (vra.mdb) (See Public Function ImportISI (filename As String) in the database modules for details about the scripts.) We used Access database to create a dataset on co-authorships. Retrieved co-author information based on different criteria and exported to text file (.txt or .net) so that further visualization in Pajek can be done. In general, there are 3 steps to generate a Pajek input file:
a) Use each one of the following MakeTable query to generate vertices information of co-authors:
i. vs_co_author_1_make_ids_most_collaborative
ii. vs_co_author_1_make_ids_most_collaborative_or_productive
iii. vs_co_author_1_make_ids_most_productive
Any of these queries generates a basic vertex list, creates a new table named “vs_co_author_ids”, and put records in it.
Before continuing for the next step, please add a primary key named “ID” (datatype “auto-number” into this table “vs_co_author_ds”;
b) Open query “vs_co_author_2_show_vertices” and export (File->Export…) to a text file;
c) Open query “vs_co_author_3_show_edges” and export (File->Export to a text file.
Merge the vertices and edges text files into one file (you can just copy paste) and then visualize it in Pajek.
Co-author network of most productive
and best connected authors with the strongest co-authorship relations. Circles
denote author nodes and are labeled by the authors last name and first
initials. Edges represent co-authorship relations.
Legend:
Node – author
Node area size - # of publications.
Node area color - # of unique
co-authors
Node edge color - # of
co-authorships.
■ 1-9
■ 10-19
■ 20-29
■ 30-39
■ 40-49
■ 50
or more
Update May 2007
An update of the analysis (with new data retrieved in April 2007) will be published in Ecology and Society. The datafiles can be downloaded here: resilience; vulnerability and adaptation