 Using Deltagraph Pro to Visualize Problems in
Geology
This assignment will help you to use Deltagraph Pro to visualize the
data from a couple of geologic problems.
Exercise 1--Sediment provenance analysis.
Choose a suitable means of charting the two sets of clast counts that we
did for the White Tanks and discuss the potential differences. What could
the clasts tell you about the geologic history of the deposits and
associated surfaces? Note that we looked at the data from the O surface in
our
lecture.
CLAST TYPE	O surface	M1b surface
gneiss            39	        43
granites	37	        41
felsic dikes	43	        46
mafic dikes	3	         1
T. volcs	0	        23
soil carbonates	8	         0
vein quartz	8	        14
Here is a simple geologic map of the White Tanks indicating the location
of the samples.
Mike Alter White Tanks Geology Map
Write your interpretation on the Chart using the text tool and make any
other appropriate labels. Email the entire Deltagraph file as an
attachment to glg490@asu.edu
Exercise 2--San Andreas Fault slip rate.
You are given some surveyed topographic data from a field site along the
San Andreas Fault.
1) Connect up to the public folder on Caliente, PSF640 in the Appleshare
PSF zone as guest. You will see a file there called and double-click on the
file named VanMaitre.txt. That is an excel file that includes some
annotations.
2) Select the data that you will need for the topographic map in
Deltagraph and then save the new file as a tab-delimited file.
3) At some point, either in Excel or Deltagraph, delete points 346-356,
420, 421. Those were of points beyond the area that we are interested in.
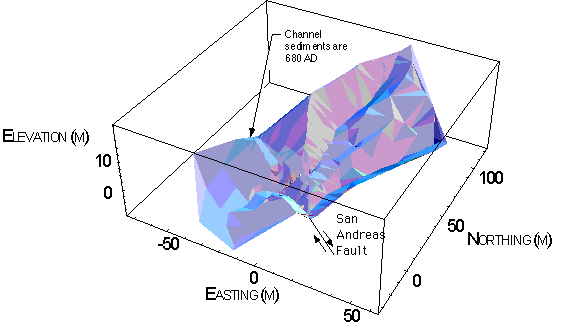
4) Make a topographic map of the data. You will see something that looks
like this:

Here is a view on the ground at the site.
Given the age of the fluvial deposits in the channel to the NW of 680 AD,
and assuming that it is beheaded; the drainage used to go along it before
flowing in its current channel, what is the offset of the beheaded channel,
and what is the slip rate (offset divided by age)?
Write your interpretation on the Chart using the text tool and make any
other appropriate labels. Email the entire Deltagraph file as an
attachment to glg490@asu.edu
Pages maintained by
Prof. Ramón Arrowsmith
Pages last modified on Tues Oct 7 1997.


