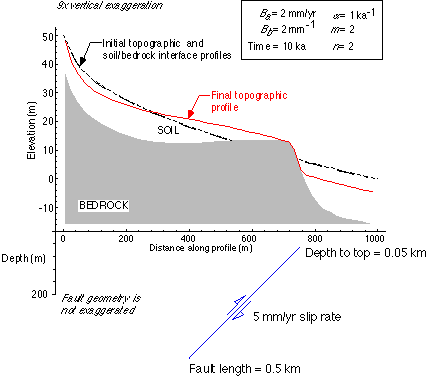
Geomorphic displacements subject to transport and production limited conditions and a variety of transport processes including diffusive and overland flow are determined. Tectonic displacements due to a fault modeled with two superimposed dislocations are also determined. The final topographic and soil/bedrock interface profiles are returned.
The above example illustrates the capability of simulating topographic and soil/bedrock interface development. The initial longitudinal profile and soil/bedrock interface are shown in dashes for this small river. Constant elevation boundary conditions are specified. The plot shows the final topographic (red) and soil/bedrock interface (edge of grey polygon) profiles at 10 ka. The unexaggerated fault geometry is shown below (blue). The slip rate along the buried thrust fault is 5 mm/yr. The increased uplift rate causes the material to erode faster than soil is produced so bedrock is exposed and conditions are production-limited for the portion of the profile immediately above the top of the buried thrust fault. This result has important implications for the interpretation of earthquake hazards due to buried thrust faults.
The method and many more results are discussed in the following references:
Arrowsmith, J R., Coupled tectonic deformation and geomorphic degradation along the San Andreas Fault System, Stanford University PhD. Dissertation, 347 p., 1995.
Arrowsmith, R., D. D. Pollard and D. D. Rhodes, HILLSLOPE
DEVELOPMENT IN AREAS OF ACTIVE TECTONICS , Journal of Geophysical
Research, Special Section on Paleoseismology,B3, 6,255--6,275, 1996.
Correction: Journal of Geophysical Research, 104, B1, 805, 1999..