State Precipitation &
Temperature Update for
Conditions through January 2008
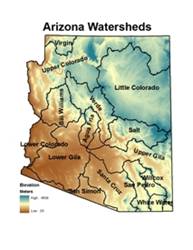
Precipitation
is monitored for the state of
Here, precipitation
percentile values for the most recent month, along with previous 3-, 6-, 12-,
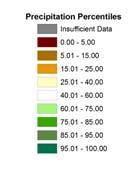
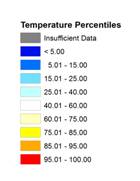
24-, 36-, and 48-month total are shown for each watershed. Low percentile values (brown shading) indicate
dry conditions while high values (green shading) indicate wet conditions. For
example, a precipitation total that falls at the 100th percentile
means that it is the highest precipitation total for the 1971-present period.
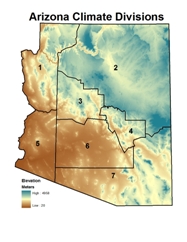 Temperature is monitored for the state of
Here, temperature
percentile values for the most recent month, along with previous 3-, 6-, 12-,
24-, 36-, and 48-month averages are shown for each climate division. Low percentile values (blue shading) indicate
cool conditions while high values (orange/red shading) indicate hot conditions.
For example, a temperature that falls at the 100th percentile means
that it is the highest average temperature for the 1895-present period.
The maps of the seven
periods for precipitation and temperature are shown below, with tables of the
percentile values and descriptive text following the maps. Current update is 02/20/2008. The data are preliminary.
Precipitation Percentiles by Watershed (through
January 2008)
Temperature Percentiles by Climate
Division (through January 2008)
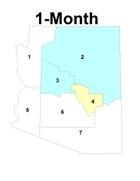

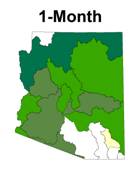
SHORT TERM CONDITIONS: 1-6 MONTHS
Like December, January
was extremely wet most places in the state, above the 78th
percentile. The exceptions were in the
northwest and southeast, where precipitation was near average. January temperatures were near average along
the lower Colorado River and in the southern climate divisions, and well below
average in central and northeastern
|
Watershed |
Precipitation Percentile |
Climate
Division |
Temperature Percentile |
|
Virgin |
56.76 |
CD1 |
49.12 |
|
|
97.37 |
CD2 |
28.95 |
|
Little |
83.78 |
CD3 |
32.89 |
|
Verde |
84.21 |
CD4 |
61.40 |
|
Bill
Williams |
89.47 |
CD5 |
54.82 |
|
|
84.21 |
CD6 |
53.07 |
|
|
86.84 |
CD7 |
53.07 |
|
Salt |
89.47 |
|
|
|
|
84.21 |
|
|
|
|
78.95 |
|
|
|
|
57.89 |
|
|
|
San Pedro |
47.37 |
|
|
|
Willcox
Playa |
39.47 |
|
|
|
San Simon |
86.84 |
|
|
|
White
Water Draw |
40.54 |
|
|
JANUARY 2008: percentiles of precipitation for the 15
|
Watershed |
Precipitation Percentile |
Climate
Division |
Temperature Percentile |
|
Virgin |
68.57 |
CD1 |
75.88 |
|
|
91.89 |
CD2 |
62.28 |
|
Little |
86.11 |
CD3 |
62.28 |
|
Verde |
86.11 |
CD4 |
83.33 |
|
Bill
Williams |
86.49 |
CD5 |
77.19 |
|
|
86.49 |
CD6 |
78.95 |
|
|
91.89 |
CD7 |
71.93 |
|
Salt |
94.59 |
|
|
|
|
75.68 |
|
|
|
|
81.08 |
|
|
|
|
83.78 |
|
|
|
San Pedro |
71.43 |
|
|
|
Willcox
Playa |
63.89 |
|
|
|
San Simon |
89.19 |
|
|
|
White
Water Draw |
63.89 |
|
|
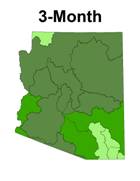
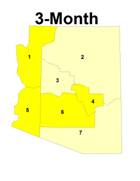
NOVEMBER 2008 - JANUARY 2008
(3-month): percentiles of precipitation for
the 15
|
Watershed |
Precipitation Percentile |
Climate
Division |
Temperature Percentile |
|
Virgin |
14.71 |
CD1 |
76.32 |
|
|
83.78 |
CD2 |
77.19 |
|
Little |
72.22 |
CD3 |
80.70 |
|
Verde |
80.56 |
CD4 |
90.35 |
|
Bill
Williams |
64.86 |
CD5 |
84.21 |
|
|
64.86 |
CD6 |
91.23 |
|
|
75.68 |
CD7 |
84.21 |
|
Salt |
81.08 |
|
|
|
|
48.65 |
|
|
|
|
62.16 |
|
|
|
|
45.95 |
|
|
|
San Pedro |
48.57 |
|
|
|
Willcox
Playa |
47.22 |
|
|
|
San Simon |
62.16 |
|
|
|
White
Water Draw |
47.22 |
|
|
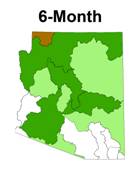
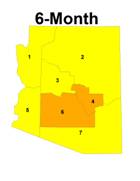
AUGUST 2008 – JANUARY 2008 (6-month): percentiles of precipitation for the 15
INTERMEDIATE
TERM CONDITIONS: 12-24 MONTHS
The 12-month period has
improved across almost every watershed with 8 watersheds well above average, 5
near average and only 2 below average. The 12-month period became warmer for
most climate divisions with all climbing above the 86th percentile.
The 24 month period
is no longer the driest long-term period.
Three watersheds in the southeast are well above average, five are now
near average, four are slightly below average and three remain well below
average. The driest are in northwest and
west central
Watershed |
Precipitation Percentile |
Climate
Division |
Temperature Percentile |
|
Virgin |
5.71 |
CD1 |
86.73 |
|
|
75.68 |
CD2 |
94.69 |
|
Little |
72.97 |
CD3 |
92.04 |
|
Verde |
62.16 |
CD4 |
92.92 |
|
Bill
Williams |
43.24 |
CD5 |
93.81 |
|
|
51.35 |
CD6 |
98.23 |
|
|
81.08 |
CD7 |
96.46 |
|
Salt |
78.38 |
|
|
|
|
59.46 |
|
|
|
|
62.16 |
|
|
|
|
37.84 |
|
|
|
San Pedro |
40.54 |
|
|
|
Willcox
Playa |
40.54 |
|
|
|
San Simon |
62.16 |
|
|
|
White
Water Draw |
41.67 |
|
|
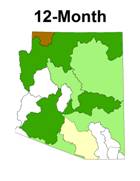
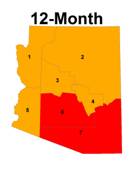
FEBRUARY 2008 – JANUARY 2008
(12-month): percentiles of precipitation for
the 15
|
Watershed |
Precipitation Percentile |
Climate
Division |
Temperature Percentile |
|
Virgin |
17.65 |
CD1 |
79.46 |
|
|
44.44 |
CD2 |
88.39 |
|
Little |
52.78 |
CD3 |
90.18 |
|
Verde |
36.11 |
CD4 |
90.18 |
|
Bill
Williams |
19.44 |
CD5 |
91.07 |
|
|
25.00 |
CD6 |
92.86 |
|
|
52.78 |
CD7 |
96.43 |
|
Salt |
52.78 |
|
|
|
|
38.89 |
|
|
|
|
61.11 |
|
|
|
|
33.33 |
|
|
|
San Pedro |
50.00 |
|
|
|
Willcox
Playa |
66.67 |
|
|
|
San Simon |
30.56 |
|
|
|
White
Water Draw |
63.89 |
|
|
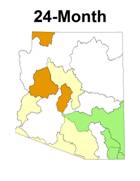
FEBRUARY 2007 – JANUARY 2008
(24-month): percentiles of precipitation for
the 15
LONG TERM
CONDITIONS: 36-48 MONTHS
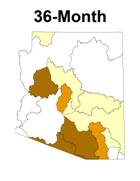
The 36-month period has
become the driest period with 14 watersheds below the 50th
percentile, 10 below the 37th percentile, and 5 below the 22nd
percentile. The driest are the Bill
Williams and Agua Fria in west central
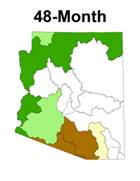
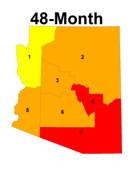
The 48-month period continues
to show above average precipitation across the western and northern watersheds,
near average precipitation in the central and eastern watersheds, and below
average precipitation in the southern watersheds. Both the San Simon and
|
|
Precipitation Percentile |
Climate
Division |
Temperature Percentile |
|
Virgin |
33.33 |
CD1 |
75.68 |
|
|
42.86 |
CD2 |
90.99 |
|
Little |
45.71 |
CD3 |
91.89 |
|
Verde |
28.57 |
CD4 |
93.69 |
|
Bill
Williams |
11.43 |
CD5 |
89.19 |
|
|
17.14 |
CD6 |
93.69 |
|
|
54.29 |
CD7 |
99.10 |
|
Salt |
37.14 |
|
|
|
|
48.57 |
|
|
|
|
37.14 |
|
|
|
|
14.29 |
|
|
|
San Pedro |
22.86 |
|
|
|
Willcox
Playa |
37.14 |
|
|
|
San Simon |
11.43 |
|
|
|
White
Water Draw |
48.57 |
|
|
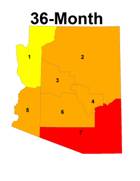
FEBRUARY 2006 – JANUARY 2008
(36-month): percentiles of temperature, and
precipitation for the 15
|
Watershed |
Precipitation Percentile |
Climate
Division |
Temperature Percentile |
|
Virgin |
67.74 |
CD1 |
76.36 |
|
|
76.47 |
CD2 |
91.82 |
|
Little |
47.06 |
CD3 |
88.18 |
|
Verde |
55.88 |
CD4 |
95.45 |
|
Bill
Williams |
50.00 |
CD5 |
88.18 |
|
|
52.94 |
CD6 |
93.64 |
|
|
64.71 |
CD7 |
99.09 |
|
Salt |
55.88 |
|
|
|
|
82.35 |
|
|
|
|
47.06 |
|
|
|
|
8.82 |
|
|
|
San Pedro |
32.35 |
|
|
|
Willcox
Playa |
50.00 |
|
|
|
San Simon |
14.71 |
|
|
|
White
Water Draw |
52.94 |
|
|
FEBRUARY 2005 – JANUARY 2008
(48-month): percentiles of temperature, and
precipitation for the 15
February 2008 Arizona
Drought Update based on precipitation data through January 2008)
The
following summary describes the heat and dryness across the state for the 1-,
3-, 6-, 12-, 24-, 36-, and 48-month periods.
SUMMARY
Like December, January
was extremely wet most places in the state, above the 78th
percentile. The exceptions were in the
northwest and southeast, where precipitation was near average. January temperatures were near average along
the lower Colorado River and in the southern climate divisions, and well below
average in central and northeastern
The 3-month period
of November through January has been extremely wet across most of the state,
averaging between the 63rd and 95th percentile. All three months have had strong winter
storms that tapped into subtropical moisture.
Although all climate divisions of the state had above-average 3-month
temperatures, much of the precipitation has fallen as snow, and the snow pack
remains well above average. For the
second month in a row, the 3-month temperatures have dropped across the state.
The 6-month period
precipitation was again near- to slightly below-average in the southeast, and
well above average in all other watersheds.
This period reflects the tail end of the wet monsoon along with the wet
winter. The dry spot in the state is the
Virgin watershed, which is just below the 15th percentile. The Virgin watershed received almost no
monsoon precipitation, and has only received winter precipitation from a few of
the storms, particularly the December events.
The colder than average winter temperatures have brought all but two
climate divisions down below the 85th percentile. Last month all 7 divisions were above the 85th
percentile.
The 12-month period
has improved across almost every watershed with 8 watersheds well above
average, 5 near average and only 2 below average. The 12-month period became
warmer for most climate divisions with all climbing above the 86th
percentile.
The 24 month period
is no longer the driest long-term period.
Three watersheds in the southeast are well above average, five are now near
average, four are slightly below average and three remain well below
average. The driest are in northwest and
west central
The 36-month period
has become the driest period with 14 watersheds below the 50th
percentile, 10 below the 37th percentile, and 5 below the 22nd
percentile. The driest are the Bill
Williams and Agua Fria in west central
The 48-month period
continues to show above average precipitation across the western and northern
watersheds, near average precipitation in the central and eastern watersheds,
and below average precipitation in the southern watersheds. Both the San Simon and