State Precipitation &
Temperature Update for
Conditions through June 2007
Precipitation
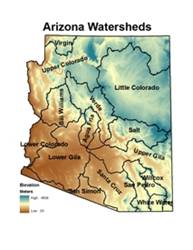
is monitored for the state of
Here, precipitation
percentile values for the most recent month, along with previous 3-, 6-, 12-,
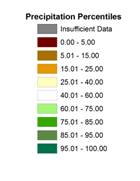
24-, 36-, and 48-month total are shown for each watershed. Low percentile values (brown shading) indicate
dry conditions while high values (green shading) indicate wet conditions. For
example, a precipitation total that falls at the 100th percentile
means that it is the highest precipitation total for the 1971-present period.
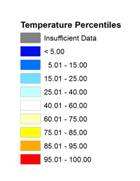
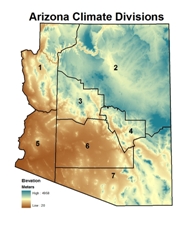 Temperature is monitored for the state of
Here, temperature
percentile values for the most recent month, along with previous 3-, 6-, 12-,
24-, 36-, and 48-month averages are shown for each climate division. Low percentile values (blue shading) indicate
cool conditions while high values (orange/red shading) indicate hot conditions.
For example, a temperature that falls at the 100th percentile means
that it is the highest average temperature for the 1895-present period.
The maps of the seven
periods for precipitation and temperature are shown below, with tables of the
percentile values and descriptive text following the maps. Current update is 7/25/2007. The data are preliminary.
Precipitation Percentiles by Watershed
(through June 2007)
Temperature Percentiles by Climate
Division (through June 2007)
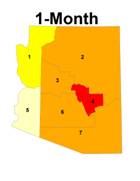
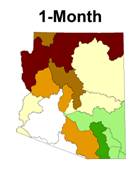
SHORT TERM CONDITIONS: 1-6 MONTHS
June is generally a
dry month across
|
Watershed |
Precipitation Percentile |
Climate
Division |
Temperature Percentile |
|
Virgin |
13.89 |
CD1 |
83.19 |
|
|
2.70 |
CD2 |
86.73 |
|
Little |
37.84 |
CD3 |
86.28 |
|
Verde |
13.51 |
CD4 |
95.58 |
|
Bill
Williams |
17.57 |
CD5 |
69.91 |
|
|
18.92 |
CD6 |
88.05 |
|
|
48.65 |
CD7 |
89.38 |
|
Salt |
35.14 |
|
|
|
|
29.73 |
|
|
|
|
72.97 |
|
|
|
|
24.32 |
|
|
|
San Pedro |
81.08 |
|
|
|
Willcox
Playa |
60.81 |
|
|
|
San Simon |
51.35 |
|
|
|
White
Water Draw |
67.57 |
|
|
JUNE 2007: percentiles of precipitation for the 15
|
Watershed |
Precipitation Percentile |
Climate
Division |
Temperature Percentile |
|
Virgin |
22.22 |
CD1 |
86.28 |
|
|
32.43 |
CD2 |
88.50 |
|
Little |
21.62 |
CD3 |
92.04 |
|
Verde |
8.11 |
CD4 |
98.23 |
|
Bill
Williams |
10.81 |
CD5 |
79.65 |
|
|
13.51 |
CD6 |
86.73 |
|
|
35.14 |
CD7 |
87.17 |
|
Salt |
24.32 |
|
|
|
|
32.43 |
|
|
|
|
51.35 |
|
|
|
|
21.62 |
|
|
|
San Pedro |
40.54 |
|
|
|
Willcox
Playa |
59.46 |
|
|
|
San Simon |
29.73 |
|
|
|
White
Water Draw |
59.46 |
|
|
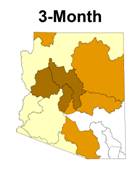
APRIL 2006 - JUNE 2007 (3-month): percentiles of precipitation for the 15
|
Watershed |
Precipitation Percentile |
Climate
Division |
Temperature Percentile |
|
Virgin |
14.29 |
CD1 |
84.07 |
|
|
18.92 |
CD2 |
84.07 |
|
Little |
22.22 |
CD3 |
88.50 |
|
Verde |
16.22 |
CD4 |
93.81 |
|
Bill
Williams |
8.11 |
CD5 |
78.76 |
|
|
18.92 |
CD6 |
89.38 |
|
|
27.03 |
CD7 |
91.15 |
|
Salt |
21.62 |
|
|
|
|
18.92 |
|
|
|
|
45.95 |
|
|
|
|
18.92 |
|
|
|
San Pedro |
43.24 |
|
|
|
Willcox
Playa |
52.78 |
|
|
|
San Simon |
18.92 |
|
|
|
White
Water Draw |
66.67 |
|
|
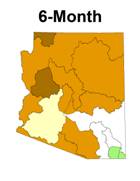
JANUARY 2006 – JUNE 2007 (6-month): percentiles of precipitation for the 15
INTERMEDIATE
TERM CONDITIONS: 12-24 MONTHS
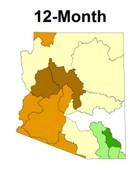
The 12-month period
reflects both the past winter and last year’s monsoon. For all areas of the state except the
southeast, the entire 12 month period was exceptionally dry. The southeast watersheds received
above-average rainfall during the 2006 monsoon season, bringing flooding to
many locations, including
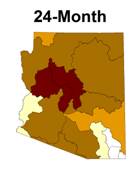
The two-year period
precipitation is evidence of our two consecutive years of extreme dryness. The only watersheds above the 29th
percentile are Willcox Playa and White Water Draw, which received much needed
rainfall during the 2006 monsoon. The
entire state was very warm during the past 24 months, with the southeast and
south central climate divisions having average temperatures above the 96th
percentile.
Watershed |
Precipitation Percentile |
Climate
Division |
Temperature Percentile |
|
Virgin |
17.65 |
CD1 |
79.46 |
|
|
30.56 |
CD2 |
79.46 |
|
Little |
27.78 |
CD3 |
82.14 |
|
Verde |
13.89 |
CD4 |
85.27 |
|
Bill
Williams |
8.33 |
CD5 |
83.48 |
|
|
22.22 |
CD6 |
87.50 |
|
|
22.22 |
CD7 |
86.61 |
|
Salt |
27.78 |
|
|
|
|
25.00 |
|
|
|
|
58.33 |
|
|
|
|
36.11 |
|
|
|
San Pedro |
66.67 |
|
|
|
Willcox
Playa |
80.00 |
|
|
|
San Simon |
19.44 |
|
|
|
White
Water Draw |
71.43 |
|
|
JULY 2006 – JUNE 2007 (12-month): percentiles of precipitation for the 15
|
Watershed |
Precipitation Percentile |
Climate
Division |
Temperature Percentile |
|
Virgin |
21.21 |
CD1 |
76.58 |
|
|
5.71 |
CD2 |
90.99 |
|
Little |
11.43 |
CD3 |
90.09 |
|
Verde |
2.86 |
CD4 |
91.89 |
|
Bill
Williams |
2.86 |
CD5 |
90.99 |
|
|
2.86 |
CD6 |
96.40 |
|
|
8.57 |
CD7 |
100.00 |
|
Salt |
5.71 |
|
|
|
|
28.57 |
|
|
|
|
17.14 |
|
|
|
|
8.57 |
|
|
|
San Pedro |
25.71 |
|
|
|
Willcox
Playa |
42.86 |
|
|
|
San Simon |
5.71 |
|
|
|
White
Water Draw |
45.71 |
|
|
JULY 2005 – JUNE 2007 (24-month): percentiles of precipitation for the 15
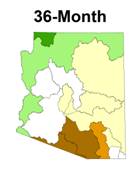
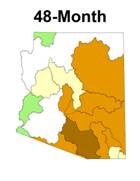
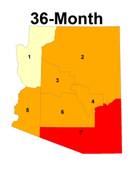
LONG TERM
CONDITIONS: 36-48 MONTHS
The 36-month precipitation
period includes the wet winter of 2004-2005 for northern
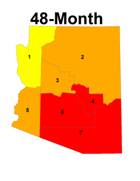
The 48-month map
shows that three of the past 4 years have been extremely dry throughout most of
Watershed |
Precipitation Percentile |
Climate
Division |
Temperature Percentile |
|
Virgin |
81.25 |
CD1 |
74.55 |
|
|
61.76 |
CD2 |
88.18 |
|
Little |
32.35 |
CD3 |
88.18 |
|
Verde |
47.06 |
CD4 |
94.55 |
|
Bill
Williams |
41.18 |
CD5 |
86.36 |
|
|
32.35 |
CD6 |
93.64 |
|
|
50.00 |
CD7 |
99.09 |
|
Salt |
38.24 |
|
|
|
|
73.53 |
|
|
|
|
38.24 |
|
|
|
|
5.88 |
|
|
|
San Pedro |
23.53 |
|
|
|
Willcox
Playa |
38.24 |
|
|
|
San Simon |
8.82 |
|
|
|
White
Water Draw |
47.06 |
|
|
JULY 2004 – JUNE 2007 (36-month): percentiles of temperature, and precipitation for the 15
|
Watershed |
Precipitation Percentile |
Climate
Division |
Temperature Percentile |
|
Virgin |
64.52 |
CD1 |
77.06 |
|
|
51.52 |
CD2 |
91.74 |
|
Little |
21.21 |
CD3 |
94.50 |
|
Verde |
27.27 |
CD4 |
96.33 |
|
Bill
Williams |
30.30 |
CD5 |
89.91 |
|
|
21.21 |
CD6 |
98.17 |
|
|
42.42 |
CD7 |
100.00 |
|
Salt |
24.24 |
|
|
|
|
66.67 |
|
|
|
|
24.24 |
|
|
|
|
12.12 |
|
|
|
San Pedro |
18.18 |
|
|
|
Willcox
Playa |
21.21 |
|
|
|
San Simon |
21.21 |
|
|
|
White
Water Draw |
36.36 |
|
|
JULY 2003 – JUNE 2007 (48-month): percentiles of temperature, and precipitation for the 15
July 2007
The
following summary describes the heat and dryness across the state for the 1-,
3-, 6-, 12-, 24-, 36-, and 48-month periods.
SUMMARY
June
is generally a dry month across
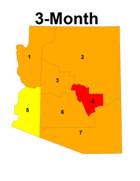
Three-month period
– Precipitation for the 3-month period of April through June was well below the
40th percentile for the northern half of the state because the shift
to La Niña
conditions resulted in relatively dry conditions in April and May. The lack of frontal storm systems also
resulted in temperatures above the 88th percentile everywhere in the
state.
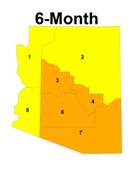
Six-month period
– The 6-month precipitation map still shows the effects of the dry winter with
only four watersheds in the southeast corner of the state above the 25th
percentile. Temperatures were above
average everywhere in the state for the 6-month period.
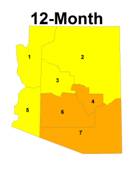
Twelve-month period
– All watersheds except those in the southeast are well below average for the
12 month period. The San Pedro, Willcox
Playa, and White Water Draw watersheds in the southeast have had above average
precipitation both during the 2006 summer, and the 2007 winter. Temperatures are above the 78th
percentile everywhere in the state.
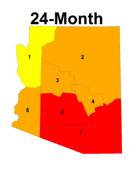
Two-year period
- has consistently been the driest period with all watersheds receiving well
below average precipitation, nine are below the 9th percentile and
two are below the 3rd percentile.
This indicates that the drought is experiencing a cyclic wet-dry regime
where each phase seems to last 12 months.
For temperature, again all divisions are above the 75th
percentile, exacerbating the dry conditions.
The southeast climate division continues to be at the 100th
percentile.
Three-year period
- The 36-month precipitation is well below average in the southeastern
watersheds and above average for the northern and western watersheds. This period includes the wet winter of
2005. The 36-month-temperature
pattern has been consistent for the past five updates, with
Four-year period
- All watersheds except the upper and lower