![]()
![]()
Development of a Single Molecule Assay to Measure F1-g Subunit Rotation.
We have also successfully completed the aim to improve the single molecule γ subunit rotation assay to enable an investigation of the mechanism of ATPase-dependent rotation. When this aim was proposed, single molecule g subunit rotation was measured via a 3000 nm fluorescent actin filament [1]. An accurate measurement of rotation rate was impossible because viscous drag on the actin was rate limiting, it was difficult to control the length of the actin filament that attached to the g subunit, and photobleaching of the fluorophores made it difficult to observe the rotation for more than short time periods. Rotation was observed in only 1% of the F1 molecules examined.
Weeks after our project was funded, a significant improvement in the assay was reported that substituted the actin filament with a 40 nm diameter gold sphere [2]. Viscous drag no longer limited rotation rate when spheres (or sphere dimers) smaller than 105 nm were used such that the observed rotation rate was due to the rate limiting step of F1. Since 40 nm gold spheres efficiently scatter green light, observation of rotation could be made without the need of fluorophores that photobleach. Measurements made with this assay revealed that the TF1g subunit rotates about 90º upon Mg2+ATP binding, followed by a 2 ms pause that corresponds to the rate-limiting step in the reaction, and a 30º rotation step to complete a catalytic event. These measurements make a major contribution to the understanding of the mechanism of the F1-ATPase. However, this assay is still inadequate to determine the stepwise mechanism in which ATP binding, hydrolysis, and product release contribute to the generation of rotational motion of the g subunit. Rotation data collected as fast as 8000 frames per second (fastest on record) were still too slow to resolve the g subunit rotation rate (sweep time). Consequently, this assay was only able to measure the dwell times (pauses) that occur between rotation events. The rotational substeps were revised from 90º and 30º to 80º and 40º, respectively, upon reevaluation using 1000 nm polystyrene spheres [3].
To measure the rotational position of the g subunit as a function of time, the centroid of the visible light scattered by the 40nm or 1000nm spheres was determined in each frame of the movie which was displaced from the axis of rotation because the rotation of the g subunit is eccentric (44). The eccentricity of the g subunit rotation is no more than 5 nm such that the rotation of many F1 molecules may not be visible by this method. Using this method, typically 1% of F1 molecules are observed to rotate such that it is difficult to know if the molecules observed are representative of the population of F1 as a whole.
In summary, the challenges in developing a suitable single molecule rotation assay were to find: (i) a probe small enough such that the observed rate of rotation represents the rate limitations of the enzyme and not the viscous drag of the probe; (ii) a probe bright enough to be observable when data are collected at very high frame rates, and that does not depend on fluorophores that could photobleach; (iii) a probe that provides a sensitive measure of the rotational position of the g subunit that does not depend on the physical displacement of the probe; (iv) a detection system capable of recording the rotation at speeds of 100,000 frames per second, thereby providing time resolution of rotational events on the order of microseconds; and (v) a detection system that can accumulate rotation data over a span of minutes. An additional goal was to improve the assay so that a larger fraction of the F1 molecules are observed to rotate, to be certain that the observed rotation was characteristic of the enzyme rather than an anomaly.
We have developed four technologies to achieve these goals that include: (i) making gold nanorods and developing the conditions for their use as a probe of rotation; (ii) flattening and coating cover slip surfaces to improve consistency of the rotation assay; (iii) devising and building a detector that can measure rotation of the gold nanorod with a time resolution sufficient for the rotation of the F1 g subunit with high signal to noise; and (iv) software development to extract the time constants of the dwells and the sweep time of rotation.
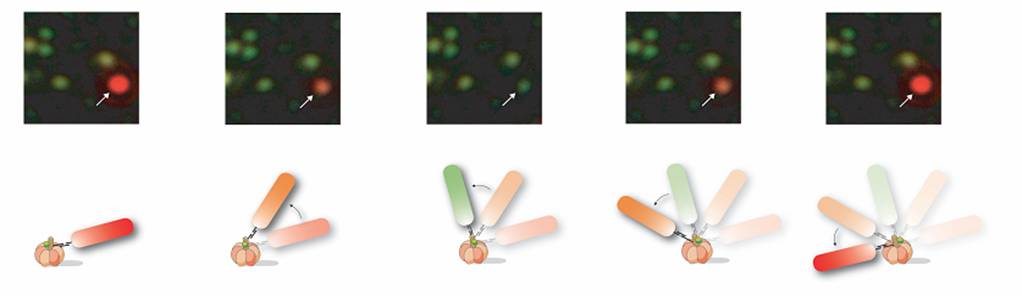
Use of Gold Nanorods to Probe g Subunit Rotation. Due to the difficulty determining rotational position of a nanosphere as described above, we substituted gold spheres for gold nanorods with approximate dimensions of 40 nm x 80 nm. The size of the rods is still below the threshold where viscous drag limits rotation rate such that measured rates are due to F1. Due to surface plasmon resonance, the long and short axes of the nanorods scatter red and green light, respectively. This efficient light scattering property allows them to be easily observed with dark field microscopy in which the incident light passes through the sample at an oblique angle and is stopped by an iris if it does not interact with the nanorod. Only the light scattered by the gold nanorod is observed, thereby eliminating the need for fluorophores that can photobleach.
Click Here to see a movie of a field of view of rods.
Click Here to see a movie of a single rod.
Nanorods also have ideal optical properties for use in determining the rotational position of the g subunit. We found that the scattered light intensity from a nanorod observed through a polarizing filter depends on the angle between the nanorod axis and the filter because light is scattered most efficiently along each axis of the rod. Thus, when the long axis of the rod is parallel to the plane of polarization, the intensity of the scattered red light is maximal while that of the green light is minimal. Similarly, the intensities of the scattered red and green light are reversed when the long axis of the nanorod is perpendicular to the plane of polarization. We determined the intensities of red and green light scattered from individual immobilized gold nanorods as a function of the polarization angle under the same conditions used to record ATP-dependent rotation of a nanorod attached to the F1-g subunit. Under these conditions the intensity profiles of the red and green light follow out of phase sine curves.

Electron micrograph of a preparation of gold nanorods used in rotation assays.
Consequently, the relative intensity of the red or green light scattered from the nanorod probe serves as a sensitive measure of the rotational position of the g subunit. ATP-driven g subunit rotation using a gold nanorod as a probe is then observed as an oscillation in the intensities of red and green light when viewed through a polarizing filter. Simply stated, the nanorod appears to blink red and green when rotating. This method allows measurements below the resolution of the wavelength of light because it does not depend upon physical displacement of the probe due to the eccentricity of rotation. The fraction of ATPase-dependent rotating rods varies among experiments, but has been observed as high as 35%. This increase in the fraction of F1 observed to rotate was made with the additional improvements described below.
Gold nanorods are not commercially available, and procedures to make them are still being developed to manipulate them [4]. To prepare nanorods, 30 nm spheres are first “grown” from HAuCl4 under reducing conditions that form elemental gold. The elemental gold is treated with a detergent, CTAB, that elongates the spheres into rods. The yield of the first published procedures was about 30% rods with significant variability in the rod length [5]. The low yield of rods reduced the number of F1 molecules that could be examined for rotation to 30%. The wavelength of light scattered by the nanorod is a function of rod length as described by Mie theory [6]. Thus, longer rods scattered light at wavelengths in the infrared, too long to be detected, further limiting the number of F1 molecules that could be examined.
We can now prepare gold nanorods with 100% yield and a narrow length distribution (Figure 8). We can control the length of the nanorods so that the wavelength of light scattered by the rod is optimized to the microscope light source and the detector used to record rotation. These procedures significantly increase the fraction of F1 molecules that can be observed to rotate. In addition, the signal to noise of the measurement is increased since the intensity of light scattered from each nanorod and detected has been increased substantially allowing rotation data to be collected with higher time resolution.
The CTAB used to promote elongation of nanospheres into rods is also required as a coating to prevent the gold in the nanorods from dispersing. This detergent is also a potent inhibitor of F1-ATPase activity at concentrations needed to stabilize the nanorods. We developed procedures to replace the CTAB coating on the nanorods with avidin so that the CTAB can be removed before the nanorods come in contact with F1. The avidin coating is also capable of binding with very high affinity to the g subunit of F1 that has been biotinylated in a location optimal for nanorod attachment.
Although nanorods prepared in this manner can be used for rotation assays, within hours of their preparation they become extremely sticky (Figure 9A) resulting in the irreversible nonspecific binding of nanorods in large numbers directly to the coverslip and causing the nanorods to clump together (Figure 9B). Thus it was difficult to locate nanorods attached to F1 that were separated far enough from other rods to prevent

Atomic Force Microscopy of (A) untreated cover slips, left, and treated, right. (B) F1 on the surface shown on the mm scale.
clumping and allow rotation. We developed a procedure in which the avidin-coated nanorods were given a second protein coat that virtually eliminated both the clumping and nonspecific binding of the rods to the coverslip (Figure 9C). This increased the fraction of F1 molecules observed to rotate during an assay dramatically (Figure 1D).
b. Development of Ni-coated Coverslips for Use in Rotation Assays. To attach Histidine-tagged F1 to the coverslip, the coverslip must be silanated with a derivative of NTA that coordinates nickel. Although commercially available, the number of F1 molecules that rotate is low with these coverslips is low. Using atomic force microscopy to examine the surface of these coverslips we found crevices large enough to engulf an F1 molecule such that the nanorod is unable either to attach or rotate (Figure 10A). We have now developed a procedure to flatten glass coverslips (Figure 10A), and then coat them with Ni-NTA. As a result,F1 moleculres can be clearly resolved on the cover slip by AFM (Figure 10B). This contributes significantly to the fraction of F1 molecules observed to rotate upon addition of Mg2+ATP.
c. Detection System Development and Data Analysis.
Microsecond Time Scale Rotation Measurements of Single F1-ATPase
Molecules

Biochemistry,
Web Release Date: February 17,
The F1Fo-ATP synthase couples the energy provided by
a transmembrane proton gradient to the production of ATP from ADP and
phosphate. The intrinsic membrane complex of ab2c10-14
subunits known as Fo1 3
3 3
3

 subunits contains one site for ATP synthesis and/or hydrolysis per
heterodimer. When F1 is purified from Fo and the
membrane, it retains the ability to hydrolyze ATP (1-3)-subunit that
rotates in response to ATP hydrolysis activity (4,
5)
subunits contains one site for ATP synthesis and/or hydrolysis per
heterodimer. When F1 is purified from Fo and the
membrane, it retains the ability to hydrolyze ATP (1-3)-subunit that
rotates in response to ATP hydrolysis activity (4,
5)
Visualization of -subunit rotation
of single F1 molecules fixed to a coverslip can be observed by
microscopy (6, 7) steps for each Mg2+-ATP consumed at saturating Mg2+-ATP
concentrations. When the substrate is limiting, each 120
step is resolved into 80 and 40
substeps that correspond to ATP binding and the rate-limiting step,
respectively (6, 8) rotation of the
-subunit in F1 from the
thermophilic bacteria PS3 (9).
After a 2 ms pause thought to involve product release, a 40
rotation of the -subunit completes the
cycle for a total of 120. The kinetics of the 2 ms
pause are consistent with the presence of sequential 1 ms steps which suggest
the existence of a rate-limiting intermediate state that follows the
transition state (10, 11)-subunit by 240
(6, 12-15)
steps for each Mg2+-ATP consumed at saturating Mg2+-ATP
concentrations. When the substrate is limiting, each 120
step is resolved into 80 and 40
substeps that correspond to ATP binding and the rate-limiting step,
respectively (6, 8) rotation of the
-subunit in F1 from the
thermophilic bacteria PS3 (9).
After a 2 ms pause thought to involve product release, a 40
rotation of the -subunit completes the
cycle for a total of 120. The kinetics of the 2 ms
pause are consistent with the presence of sequential 1 ms steps which suggest
the existence of a rate-limiting intermediate state that follows the
transition state (10, 11)-subunit by 240
(6, 12-15)
The rotation of F1-ATPase has been observed using large actin
filaments, where the rate is dependent upon the viscous drag of the reporter
group, not the intrinsic mechanism of the enzyme (16,
17)-subunit
as it rotates from one dwell to the next. We now report a method for recording
F1-ATPase -subunit rotation
with a time resolution of 2.5  s (equivalent to 400
000 fps), which resolves the velocity of the
-subunit as it rotates between dwells.
s (equivalent to 400
000 fps), which resolves the velocity of the
-subunit as it rotates between dwells.
Experimental Procedures
Escherichia coli F1-ATPase was purified from strain XL10
(18). This strain was mutated to contain
a His6 on the N-terminus of the
-subunit and
S193C for biotinylation. Biotinylation
was performed by adding an equimolar amount of biotin-maleimide (Pierce) to F1,
followed by shaking at room temperature for 1 h. Unreacted biotin-maleimide
was removed after the solution was run through a protein desalting column
(Pierce). Reaction specificity to the -subunit
was verified by SDS-PAGE with a fluorescent maleimide. The activity of the
enzyme was confirmed using the pyruvate kinase coupled assay
(18-20)
Gold nanorods were prepared by the reduction of HAuCl4 to form 4
nm seeds (21). The seeds were grown into
gold nanorods in the presence of the surfactant CTAB and additional HAuCl4.
The length and width of the gold rods were determined to be 75.08 ± 4.1 and
34.7 ± 2.2 nm, respectively (N = 30), using transmission electron
microscopy. Avidination of gold rods began with an exchange of the gold rod
buffer (100 mM CTAB) with 1 mM CTAB. Neutravidin was added directly to the
nanorod/CTAB solution to a final concentration of 40 g/mL.
The mixture was shaken at room temperature for 1 h and could be stored at room
temperature for up to 1 week. Successful avidination was verified by observing
a 4-10 nm red shift in the absorbance spectrum of the gold nanorods (Figure
1). This red shift was attributed to a change in the dielectric environment of
the gold nanorod surface (22). For use
in the rotation assay, avidinated gold nanorods were further diluted 1:10 in F1
buffer [50 mM Tris-HCl and 10 mM KCl (pH 8.0)] containing 0.1% modified BSA.
 |
Figure 1 Absorption spectra of gold nanorods before and after coating with avidin. Prior to avidination (bottom trace), gold spheres and nanorods absorb 529 and 639 nm light, respectively. Incubation of the gold rods with avidin (top trace) results in a red shift of the nanorod absorption to 642 nm. |
In a typical experiment, a Ni-NTA resin-coated glass slide was spotted with
5 L of 85 g/mL F1
such that the F1 molecules became immobilized to the Ni-NTA resin
via the three His6 tags. After a 5 min incubation, the slide was
washed for 30 s with F1 buffer. After excess liquid was wicked from
the surface, the spot containing immobilized F1 was exposed to 5
L of avidinated gold nanorods for 5 min. A final 30
s wash with F1 buffer removed unbound and nonspecifically bound
gold nanorods. Excess liquid was wicked away, and 5 L
of 2 mM MgCl2 and 1 mM ATP in F1 buffer was added.
A Leica DMIRE II inverted dark-field microscope was used to obtain
quantitative data for gold nanorod rotation driven by F1. A Sutter
LB-17 xenon light with a custom Chroma cold mirror was coupled with a Series
2000 Lumatec light guide to deliver 400-925 nm collimated light to the
dark-field condenser. The light not scattered by a gold nanorod was stopped by
an iris in the 63× variable-aperture objective. Scattered light from single
molecules was focused onto a 100 m pinhole mounted
on an xyz translation stage (Thorlabs) in the image plane at the microscope
side port. The pinhole acted as a spatial filter, blocking all light except
that originating from the molecule under study. The scattered light then
passed through a polarization filter mounted in a rotational stage (Standa,
8SMC1-USB) and was refocused onto a single photon counting avalanche
photodiode (PerkinElmer SPCM-AQR-15). The detector has a dark count of ~50
photons/s with a temporal resolution of 50 ns, equivalent to 20 million fps.
Single rotating rods were positioned confocal to the pinhole using a motorized
stage from Prior Scientific (0.002 m/micro-step
resolution) and a digital camera (Optronics, MagnaFire SP). The refresh rate
of the camera was sufficiently fast to detect the strobe effect due to
rotation, which allowed identification of the rotating gold nanorods and their
corresponding alignment to the photon counter. Output from the detector was
fed directly into a National Instruments DAQ PCI-6602 counter/timer board.
Custom software was written in LabView 7.1 to control data acquisition,
storage, and analysis of dwell times. Additional custom software was written
in Matlab 6.5 to compute the rate of rotation (transition time).
Results
The optical properties of gold nanorods were exploited in taking sensitive
measurements of rotational position. When viewed using dark-field microscopy,
an 75 nm × 35 nm nanorod resonantly scatters red and green light from the long
and short axis of the rod, respectively (23).
Incident light illuminated the sample at an oblique angle so that only light
scattered from the nanorods entered the objective. When scattered light from a
nanorod was viewed through a polarizing filter, its intensity changed as a
function of the relative angle between its longitudinal and translational axes
and the polarizing filter (Figure 2A). Light is scattered most efficiently
along the rod axes such that the intensity of scattered red light is maximal
and minimal when the long and short axes of the rod are parallel and
orthogonal to the plane of polarization, respectively. The converse is true
for the intensity of scattered green light. Therefore, the intensities of
light scattered from a gold nanorod immobilized to a single F1
-subunit change as a function of the
polarization angle (Figure 2B). The resulting intensity profiles of red and
green light follow out-of-phase sine curves.
 |
Figure 2 Light scattering properties of gold nanorods viewed through a
polarizing filter. (A) Consecutive dark-field micrographs of a stationary
rod observed when (1) the plane of polarization is parallel to the long
axis of the rod and (2-5) the filter was rotated in 45
increments. (B) Schematic of a gold nanorod attached to the F1
-subunit as it would rotate vs A.
|
To measure Mg2+-ATP-dependent
-subunit rotation, the intensity of red
light scattered from single nanorods was acquired as a function of time. As a
control, the scattered light intensity at a given rate of data acquisition was
established when the rod was not rotating (Figure 3A). The signal generated by
the nanorod in the presence of 1 mM MgCl2 and 2 mM ATP, acquired at
the same collection rate and scale, is shown in Figure 3B. To establish the
maximum and minimum intensities of scattered light at that data acquisition
rate, the polarizing filter was rotated when the nanorod was not rotating
(Figure 3C). The observed depth of oscillation in the presence of substrate
was consistent with the intensity range predicted by Figure 3C, indicating
that the variation in signal was due to Mg2+-ATP-dependent
-subunit rotation. The average
rate-limiting dwell time from 22 molecules was determined to be 8.3 ms. The
kcat of Mg2+-ATP hydrolysis for these F1
preparations was 130 s-1 (7.7 ms) at 1 mM Mg2+-ATP,
which is consistent with the 8.3 ms rate-limiting dwell observed between
rotational events.
 |
Figure 3 Confirmation of F1-dependent rotation of a gold
nanorod using a single photon counter. Data sets of the same gold rod were
collected after assembly with F1 at an acquisition rate of 1
kHz. Scattered red light intensity profiles of the gold nanorod were
measured (A) while it was not rotating, (B) during ATP-dependent F1
rotation, and (C) while the rod was stationary but the polarizer was
rotated 360 to establish maximum and minimum
intensity values of scattered red light. |
The minimum and maximum intensity values occur when the rod is
perpendicular and parallel to the plane of polarization, respectively.
Therefore, transitions between these extremes correspond to rotation of the
gold nanorod by 90. Figure 4A shows
-subunit rotation data collected at 400
kHz when the polarizing lens was aligned with one of the dwell states parallel
to the plane of polarization (Figure 4B). Consequently, when aligned as in
Figure 4C, a 120 rotational event from dwell
position I to II would cause the rod to begin at an intermediate intensity
value, pass through a minimum, and end near a maximum. The converse is true
for rotation events from dwell position II to III. Rotation data from dwell
position III to I do not span the entire range of light intensity and thus did
not meet the selection criteria for further analysis.
 |
Figure 4 Measurements of F1-ATPase
-subunit rotation. (A) F1-ATPase
rotation-dependent changes in scattered red light intensity collected at
400 kHz. (B) Schematic of the rod orientation between F1 and
the plane of polarization. Approximate position of dwell states I-III
relative to the maximum and minimum intensity values of scattered red
light.
|
The stochastic nature of each rotational event makes it difficult to
determine the rod position at the start and end of any single rotation event.
Since the most sensitive measure of the 120 rotation
is the 90 subset that caused a change between
minimum and maximum intensity values, these changes were used to measure
rotation rate. The effects of intensity range and linearity on the calculation
of transition time were determined. Figure 5 shows the average calculated
transition time as a function of R2 values which span five
different intensity ranges. When transitions that spanned 90% of the total
possible range were considered, there was substantial variation for R2
values of <0.95. As larger intensity ranges were considered, the calculated
transition time was more consistent as the R2 value
decreased. Calculated transition times converged to similar values for data
that spanned at least 90% of the total intensity range and had R2
values greater than 0.95.
 |
Figure 5 Effects of data selection criteria on the calculated transition time. Transition times were calculated as a function of R2 values from light intensity changes between percentile ranges from 99th to 1st (98%), 98th to 2nd (96%), 97th to 3rd (94%), 96th to 4th (92%), and 95th to 5th (90%). The difference in the calculated transition time is not sensitive to the R2 values greater than 0.95 for each percentile range as shown in the boxed region. |
An example transition from a data set collected at 400 kHz is shown in
Figure 6A. This transition, which had an R2 value of 0.987
from a linear least-squares regression, did not contain any apparent variation
in rate over the 90 of rotation that was assessed.
The variation of transitions that satisfy the selection criteria is shown in
Figure 6B. Most events show a constant slope during rotation. However, there
is evidence of a short pause in some of the transitions. Although each 120
step is composed of 80 and 40
substeps, the stochastic nature of a single rotational event causes
variability in the proportion of 80 and 40
substeps that are included in any 90 data
acquisition. Therefore, attempts to distinguish differences in the transition
time of these substeps were not made.
Figure 7 depicts the average time required for the
-subunit to rotate 90
as a function of the data acquisition rate to show the minimum acquisition
rate required to resolve the sweep time. These measurements were obtained at
resolutions between 100 and 2.5 s (equivalent to
acquisition rates of 10000-400000 fps). The transition time calculated from
data acquired at rates faster than 50 kHz showed no significant deviation. The
average transition time from these data for 22 F1 molecules
containing more than 72 000 rotational events was determined to be 7.62 ± 0.15
(standard deviation) rad/ms.
Each catalytic event can be examined as both a dwell associated with the
rate-limiting step and a rotational transition related to the power stroke of
an engine. Torque generated by F1 is calculated using the laminar
flow Stokes equation

where
 is the angular velocity and
 is the drag coefficient. However, torque
changes with the drag coefficient depending upon how the rod binds to the
-subunit according to the following
equation:
is the drag coefficient. However, torque
changes with the drag coefficient depending upon how the rod binds to the
-subunit according to the following
equation:
where
is the nanorod radius, x1
and x2 correspond to the length of the nanorod in terms of
the attachment point, and  is the
viscosity of the medium (1 × 10⁻³ N s m-2 at 25
C). However, to use this equation, knowledge of the
nanorod orientation relative to the axis of rotation is required. Since this
information is not generally available, it has been assumed that, on average,
attachment of the -subunit to the
nanoparticle occurs near the middle of its longitudinal axis so that
can be modeled by
is the
viscosity of the medium (1 × 10⁻³ N s m-2 at 25
C). However, to use this equation, knowledge of the
nanorod orientation relative to the axis of rotation is required. Since this
information is not generally available, it has been assumed that, on average,
attachment of the -subunit to the
nanoparticle occurs near the middle of its longitudinal axis so that
can be modeled by
On the basis of eq 3, a constant velocity of 7.62 rad/ms implies that the average torque generated by the
-subunit
is ~47.4 ± 4.2 pN nm, similar to values reported elsewhere
(1, 24)
 |
Figure 6 Subset of rotational events. (A) A single transition from the data set in Figure 4A showing data points and the associated trend line (R2 = 0.987). (B) Superposition of transitions acquired at 100 kHz. The transition depicted in red is representative of the fastest and most common type of transition observed. The transition depicted in yellow represents a subpopulation of events that contain an intermediate pause. |
 |
Figure 7 Average transition time calculated from data collected from five F1 molecules at acquisition rates between 10 and 400 kHz. |
Information concerning the orientation of a gold nanorod relative to the
axis of rotation and the plane of polarization was obtained by examining the
relationship between time-averaged locations of the three dwells and the angle
of the polarizing filter. When the axis of rotation is orthonormal to the
plane of polarization, three peaks in the histograms of the intensity values
should be observed that correspond to each dwell. As the polarizer is rotated,
the contribution of each dwell state should follow three sine curves offset by
60 (Figure 8A). The following equation models the
behavior of the F1 molecule when it is aligned as in Figure 8A
where
is a scaling term dependent upon
the data acquisition rate and each X represents a normally distributed
population of values for relative positions of the dwell states to the
polarization filter.
 |
Figure 8 Contributions of dwell states to the intensity profile as a
function of polarizing filter alignment acquired at 1 kHz. (A) Simulation
of relative contributions from each dwell when the axis of rotation is
orthonormal to the plane of polarization. As the polarizer is rotated, the
contribution of each dwell state is modeled by three sine curves offset by
60. Vertical lines B-D correspond to relative
dwell locations depicted in the insets of panels B-D. Intersections
between the sine curves and the vertical lines correspond to peaks in the
intensity profiles. (B-D) Histograms of intensity values from rotation
data acquired at 1 kHz when the orientations between the plane of
polarization and dwell states occur as depicted in the respective insets.
Positions I-III represent consecutive dwell states which contribute to
intensity peaks as labeled.
|
Panels B and D of Figure 8 show histograms of dwell states during ATP-dependent rotation when the polarized lens was oriented such that a dwell was aligned with maximum and minimum intensity values, respectively. In these cases, two peaks overlap and were maximally spaced from the other as predicted by alignment of states B and D in Figure 8A. When the polarized lens was moved out of alignment with a dwell state, light intensity values of the three dwell states diverged (Figure 8C), as predicted by alignment state C in Figure 8A. Therefore, the orientation of the gold rod to the axis of rotation and the plane of polarization can be determined by observing the changes in the relationship between intensity peaks as a function of the polarization angle. Of the 22 molecules examined, 19 exhibited this behavior.
The three remaining molecules did not follow the pattern predicted by the
model described by eq 4. Figure 9A shows consecutive histograms of intensity
values as a function of the polarization angle during ATP-dependent rotation
of one such molecule. When viewed collectively, only two dwell states offset
by 90 were observed. This observation strongly
suggests a molecule orientation where the axis of rotation of the
-subunit was at a 45
angle with respect to the plane of polarization, and the end of the
longitudinal axis of the gold nanorod was bound at a 45
angle with respect to the -subunit
(Figure 9C). This configuration likely resulted from variation in the glass
surface and the location of attachment of avidin to the gold nanorod. The
motion of the gold rod was limited to a cone oriented such that the tip of the
cone was at the axis of rotation and the body was contained within a single
octant. In this case, the projection of the rod onto the plane of polarization
would result in one state contributing a constant minimum intensity value
while the other two states appear to be 90 from one
another. Consequently, an intensity change from the minimum to the maximum
values should correspond to rotation of the
-subunit by 120
rather than 90.
 |
Figure 9 Consecutive histograms of intensity values as a function of
the polarization angle during ATP-dependent rotation. Histogram series of
experimental results from a single molecule (A) and simulated results (B)
of intensity values as a function of the relative angle between the plane
of polarization and the dwell states. (C) Three-dimensional model of rod
orientation, where the projection of the dwell states into the
two-dimensional viewing plane results in two distinguishable states that
appear 90 apart. |
A simulation of the changes in the histograms as a function of the angle of
polarization (Figure 9B) was generated using the following function:
This equation models the behavior of the F1 molecule when it is aligned as in Figure 9C, where
is a
scaling term dependent upon the data acquisition rate. Each Xn
represents a normally distributed population of values for relative positions
of the polarization filter. The function  (X3)
is a term for the contribution of the dwell state that is aligned with the
observation perspective. The observed behavior of the molecules was consistent
with the trends predicted by the model. In addition, the instantaneous
velocity of these three molecules was consistent with values determined for
the other molecules traveling 90 when these
molecules were assumed to rotate 120. Both results
support the proposed orientation of the axis of rotation and nanorod
attachment. On the basis of this orientation of the gold nanorod, eq 2 was
used to calculate the instantaneous torque of 63.3 ± 2.9 pN nm for these F1
molecules.
(X3)
is a term for the contribution of the dwell state that is aligned with the
observation perspective. The observed behavior of the molecules was consistent
with the trends predicted by the model. In addition, the instantaneous
velocity of these three molecules was consistent with values determined for
the other molecules traveling 90 when these
molecules were assumed to rotate 120. Both results
support the proposed orientation of the axis of rotation and nanorod
attachment. On the basis of this orientation of the gold nanorod, eq 2 was
used to calculate the instantaneous torque of 63.3 ± 2.9 pN nm for these F1
molecules.
Discussion
Rotation of the F1 -subunit
was first measured using an actin filament probe where the rate of rotation
was limited by the viscous drag of the filament (16,
17)
The results presented here show that the instantaneous velocity of
-subunit rotation occurs at a constant
rate of 7.62 ± 0.15 (standard deviation) rad/ms. This measurement was made
using a novel technology capable of achieving a temporal resolution of 2.5
s (400 kHz). The measurement was confirmed by
comparing transition times observed at increasing acquisition rates, until the
transition time was independent of the temporal resolution. This occurred at
an acquisition rate of at least 50 kHz, corresponding to a resolution of 20
s.
Observed dwell times at saturating substrate concentrations were consistent
with bulk measurements of E. coli F1 Mg2+-ATPase
activity. The average dwell time was 8.3 ms, which was substantially longer
than that measured in F1 from the thermophilic bacterium PS3
(6). Dwells were best resolved at an
acquisition rate of 1 kHz such that each dwell measurement was the sum of the
time spent pausing and rotating. Consequently, the actual dwell time for E.
coli F1 is ~8.03 ms since it takes approximately 0.27 ms for
the -subunit to rotate 120
during a single catalytic event.
On the basis of the results presented here, the average torque generated
during rotation was ~47.4 ± 4.2 pN nm, comparable to that previously reported
for F1 from PS3 (1, 24,
27)-subunit is ~12 nm from the surface,
and therefore, these interfacial effects on the drag coefficient should be
negligible. The calculated work done by F1 during a single
transition was, on average, 99.3 ± 8.8 pN nm. Since the gold rod is unlikely
to limit the rate of rotation, the work done will be the minimum required to
move it. The potential work that can be done during a single transition may be
greater than the actual work needed to move the rod, implying that existing
measurements are likely to underestimate the possible torque. Thus, any
measurement that results in a larger torque value is likely to reflect the
potential torque of the motor. The maximum amount of work observed during a
120 transition was 132.5 ± 6.0 pN nm. This is
significantly larger than the free energy of ATP hydrolysis (90 pN nm) under
physiological conditions (8). Therefore,
the observed torque generated by the motor cannot be explained by the free
energy of ATP hydrolysis alone. Another possible source of free energy might
be derived from the differences in affinities for the substrate and product in
the catalytic site under conditions of a favorable chemical gradient
(30).
Acknowledgment
We thank Matthew Barber, Ana Bengston, Lars Chapsky, Matthew Green, and Liyan He for insightful conversations.
Supporting Information Available
Movie showing the strobe effect used to identify rotating gold nanorods. This material is available free of charge via the Internet at http://pubs.acs.org.
This work was supported by National
Institutes of Health Grant GM50202 to W.D.F.
* To whom correspondence should be addressed. E-mail: frasch@ asu.edu. Telephone: (480) 965-8663. Fax: (480) 965-6899.
These authors contributed equally to this
work.
1. Kinosita, K., Jr., Adachi, K., and Itoh, H. (2004) Rotation of
F1-ATPase: How an ATP-driven molecular machine may work, Annu. Rev. Biophys.
Biomol. Struct. 33, 245-68.
2. Senior, A. E., and Weber, J. (2004) Happy motoring with ATP synthase,
Nat. Struct. Mol. Biol. 11, 110-2.
3. Walker, J. E., Saraste, M., and Gay, N. J. (1982) Escherichia coli
F1-Atpase Interacts with a Membrane-Protein Component of a Proton Channel,
Nature 298, 867-9.
4. Boyer, P. D. (1997) The ATP synthase: A splendid molecular machine,
Annu. Rev. Biochem. 66, 717-49.
5. Junge, W., Lill, H., and Engelbrecht, S. (1997) ATP synthase: An
electrochemical transducer with rotatory mechanics, Trends Biochem. Sci.
22, 420-3.
6. Noji, H., Yasuda, R., Yoshida, M., and Kinosita, K., Jr. (1997) Direct
observation of the rotation of F1-ATPase, Nature 386, 299-302.
7. Kinosita, K., Jr. (1999) Real time imaging of rotating molecular
machines, FASEB J. 13 (Suppl. 2), S201-8.
8. Shimabukuro, K., Yasuda, R., Muneyuki, E., Hara, K. Y., Kinosita, K.,
Jr., and Yoshida, M. (2003) Catalysis and rotation of F1 motor: Cleavage of
ATP at the catalytic site occurs in 1 ms before 40
substep rotation, Proc. Natl. Acad. Sci. U.S.A. 100, 14731-6.
9. Yoshida, M., Noji, H., and Muneyuki, E. (1997) [World smallest motor,
ATP synthase], Tanpakushitsu Kakusan Koso 42, 1396-406.
10. Kinosita, K., Jr., Yasuda, R., Noji, H., and Adachi, K. (2000) A rotary
molecular motor that can work at near 100% efficiency, Philos. Trans. R.
Soc. London, Ser. B Biol. Sci. 355, 473-89.
11. Yoshida, M., Muneyuki, E., and Hisabori, T. (2001) ATP synthase: A
marvellous rotary engine of the cell, Nat. Rev. Mol. Cell Biol. 2,
669-77.
12. Boyer, P. D., and Kohlbrenner, W. (1981) in Energy Coupling in Photosynthesis (Selman, S. S.-R., Ed.) pp 231-40, Elsevier, Amsterdam.
13. Duncan, T. M., Bulygin, V. V., Zhou, Y., Hutcheon, M. L., and Cross, R.
L. (1995) Rotation of subunits during catalysis by Escherichia coli
F1-ATPase, Proc. Natl. Acad. Sci. U.S.A. 92, 10964-8.
14. Sabbert, D., Engelbrecht, S., and Junge, W. (1996) Intersubunit
rotation in active F-ATPase, Nature 381, 623-5.
15. Senior, A. E., Nadanaciva, S., and Weber, J. (2002) The molecular
mechanism of ATP synthesis by F1F0-ATP synthase, Biochim. Biophys. Acta
1553, 188-211.
16. Panke, O., Cherepanov, D. A., Gumbiowski, K., Engelbrecht, S., and
Junge, W. (2002) Viscoelastic dynamics of actin filaments coupled to rotary F-ATPase:
Angular torque profile of the enzyme, Biophys. J. 83, 582.
17. Panke, O., Cherepanov, D. A., Gumbiowski, K., Engelbrecht, S., and
Junge, W. (2001) Viscoelastic dynamics of actin filaments coupled to rotary F-ATPase:
Angular torque profile of the enzyme, Biophys. J. 81, 1220-33.
18. Greene, M. D., and Frasch, W. D. (2003) Interactions among
R268,
Q269, and the
subunit catch loop of
Escherichia coli F1-ATPase are important for catalytic activity, J.
Biol. Chem. 278, 51594-8.
19. Lowry, D. S., and Frasch, W. D. (2005) Interactions between
D372 and
subunit N-terminus residues
K9 and
S12 are important to catalytic activity
catalyzed by Escherichia coli F1F0-ATP synthase,
Biochemistry 44, 7275-81.
20. Boltz, K. W., and Frasch, W. D. (2005) Interactions of
T273 and
E275 with the
subunit PSAV segment
that links the subunit to the
catalytic site Walker homology B aspartate are important to the function of
Escherichia coli F1F0 ATP synthase, Biochemistry
44, 9497-506.
21. Jana, N. R., Gearheart, L., and Murphy, C. J. (2001) Wet Chemical
Synthesis of high aspect ratio cylindrical gold nanorods, J. Phys. Chem.
B 105, 4065-7.
22. Raschke, G., Kowarik, S., Franzl, T., Sonnichsen, C., Klar, T. A.,
Feldmann, J., Nichtl, A., and Kurzinger, K. (2003) Biomolecular recognition
based on single gold nanoparticle light scattering, Nano Lett. 3,
935-8.
23. Moskovits, M. (1985) Surface-Enhanced Spectroscopy, Rev. Mod. Phys.
57, 783-826.
24. Junge, W., Panke, O., Cherepanov, D. A., Gumbiowski, K., Muller, M.,
and Engelbrecht, S. (2001) Inter-subunit rotation and elastic power
transmission in F0F1-ATPase, FEBS Lett. 504,
152-60.
25. Nakanishi-Matsui, M., Kashiwagi, S., Hosokawa, H., Cipriano, D. J.,
Dunn, S. D., Wada, Y., and Futai, M. (2005) Stochastic high-speed rotation of
Escherichia coli ATP synthase F1 subunit-sensitive
rotation, J. Biol. Chem. (in press).
26. Yasuda, R., Noji, H., Yoshida, M., Kinosita, K., and Itoh, H. (2001)
Resolution of distinct rotational substeps by submillisecond kinetic analysis
of F-1-ATPase, Nature 410, 898-904.
27. Panke, O., Gumbiowski, K., Junge, W., and Engelbrecht, S. (2000) F-ATPase:
Specific observation of the rotating c subunit oligomer of EFoEF1, FEBS
Lett. 472, 34-8.
28. Cheng, L., Fenter, P., Nagy, K. L., Schlegel, M. L., and Sturchio, N.
C. (2001) Molecular-scale density oscillations in water adjacent to a mica
surface, Phys. Rev. Lett. 87, 156103.
29. Zhu, Y. X., and Granick, S. (2001) Viscosity of interfacial water,
Phys. Rev. Lett., 8709.
30. O'Neal, C. C., and Boyer, P. D. (1984) Assessment of the rate of bound
substrate interconversion and of ATP acceleration of product release during
catalysis by mitochondrial adenosine triphosphatase, J. Biol. Chem.
259, 5761-7.