NOTE:  In reporting the averages from the test we drop
       the lowest scores.  This is because 20% (1 out
       of 5) of all scores will eventually be dropped.
       In comparing your average with the class average
       you need to compare with an average which is
       representative of the final average.  Dropping
       the lowest scores before reporting the average
       is one way of estimating the effect of the
       final drops. GBA

1st test

          116 students took test 1

           21 made below 27

           95 scored 27 or more

       for those 95 the average was 50.1


       test 1 grades


2nd test

         110 students took test 2

          20 made below 31

          90 scored 31 or more

       for those 90 the average was 49.6


       test 2 grades


3rd test

         103 students took test 3

          22 made below 38

          81 scored 38 or more

       for those 81 the average was 59.3

       test 3 grades


4th test

           98 students took test 4

           22 made below 28

           76 scored 28 or more

       for those 76 the average was 51.0

       test 4 grades


5th test

          92 students took test 5

          16 made below 36

          76 scored 36 or more

       for those 76 the average was 59.1

       test 5 grades


You may also compare with Spring 2002 grades.


Overall Pre-Exam Average

(An error was found in one TA's HW computations, so this
 will change slightly.  The HW average will go up a little
 once that correction is made, maybe a tenth of a point.
 GBA 12 AM Fri)

  95 students have taken four or more tests and have more
     than 120 HW points.  For these 95 students, the
     overall averages are

        test         53.0  (multiply by 0.6 to get # of points)

        HW            7.6

        QUIZ          7.1
   ________________________

     overall         46.5 points out of 80 possible pre-exam points

                or   58.2%  <-- Pre-Exam Average

    Assuming an average of 65 on the final, or 13 out of
20 points, results in a predicted overall average of 59.6.
With this predicted average a possible breakdown of grades
would be:

                44.2 - 54.1   D
                54.2 - 65.1   C
                65.2 - 75.1   B

You should figure your pre-exam total then figure how many
exam points (out of 20 possible) you need to get the grade
that you want.  Remember that the true final grade scale
ultimately depends on overall class exam performance.


FINAL EXAM

      Of the 95 students who had taken four or more tests and
      had more than 120 HW points, 95 took the final exam.
      For those 95 students the final exam average is

            22.8 out of 40, or 57.0%.

FINAL AVERAGE

 95 students took 4 or more tests plus the final exam

       for those 95 here are the averages:

         HW     7.9  (out of 10)
         quiz   7.1  (out of 10)
         test  53.0  (multiply by 0.6 to get #points)

         exam  22.8  (out of 40 - divide by 2 to get #points)

      overall  58.2  (out of 100) <-- Final Average


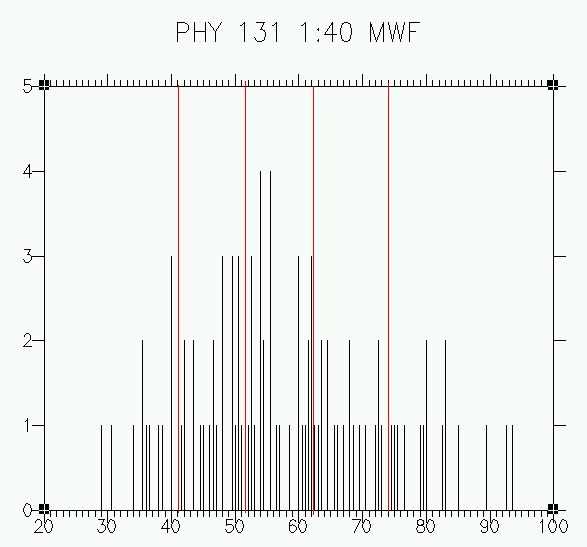
    The final grade scale was selected so as to find gaps
in the grade distribution.  Here is that final scale:

                    42.0 - 52.0   D
                    52.1 - 62.8   C
                    62.9 - 74.0   B

Letter grades were assigned strictly according to this
scale.  The highest E is 40.4, the lowest D is 42.0;  the
highest D is 51.2, the lowest C is 52.1;  the highest C
is 62.3, the lowest B is 62.9;  the highest B is 73.3,
and the lowest A is 74.5.  The smallest gap between
levels is 0.6 points between C to B.

    Be sure to check your TA's computation of your final grade.
If you find a significant error the best time to see me is
in January before the beginning of the Spring semester.  At
this point any change requires that we fill out a change-of-
grade form.  For information on how to figure your final grade
see

              HOW TO FIGURE YOUR FINAL GRADE.

Here is the final grade distribution for the 95 students
who took four or more tests plus the final exam.

You may also view this column of grades as a text file.
 131 grade distribution
