NOTE: In reporting the averages from the test we drop
the lowest scores. This is because 25% (1 out
of 4) of all scores will eventually be dropped.
In comparing your average with the class average
you need to compare with an average which is
representative of the final average. Dropping
the lowest scores before reporting the average
is one way of estimating the effect of the final
drops. These posted test averages are not used
in any way in computing the final overall class
average. GBA
1st test
163 students took test 1
Multiple Choice
124 students earned 15 or more points
for those 124 the average was 42.9%
Problems
117 students earned 11 or more points
for those 117 the average was 47.6%
test 1 MC grades<>test 1 problem grades
2nd test
149 students took test 2
Multiple Choice
116 students earned 15 or more points
for those 116 the average was 43.4%
Problems
112 students earned 17 or more points
for those 128 the average was 63.9%
test 2 MC grades<>test 2 problem grades
3rd test
128 students took test 3
Multiple Choice
104 students earned 15 or more points
for those 104 the average was 47.0%
Problems
101 students earned 13 or more points
for those 103 the average was 54.1%
test 3 MC grades<>test 3 problem grades
4th test
115 students took test 4
Multiple Choice
98 students earned 20 or more points
for those 98 the average was 56.9%
Problems
96 students earned 11 or more points
for those 96 the average was 51.8%
test 4 MC grades<>test 4 problem grades
Overall Pre-Exam Average
113 students have taken three or more MC parts and
three or more free-response parts, have a non-
zero CPS average, and have more than 1100 HW
points. For these 113 students the overall
averages are
% points
HW 85.7 11.99
RECITATION 84.9 5.94 (error corrected here 12/12 4:30 PM)
(quiz+exercises)
TP 88.2 4.41
test 51.1 27.60
_________________________________
overall 49.94 points out of 80 possible
pre-exam points
or 62.4% ... Pre-Exam Average
This Pre-Exam average is the average of all points available
BEFORE the Final Exam. The average figured on the overall
grades page is a predicted final average assuming that your
final exam score is the same as your test average for the
semester.
Assuming an average of 60 on the final, or 12 out of
20 points, results in a predicted overall average of 61.95.
Since we now provide histograms throughout the semester
which you may use to determine your approximate standing
in the class, we no longer use the above data to attempt
to predict the final grade scale.
FINAL EXAM
(3 students registered their clicker between
Test 4 and the Final Exam.) For the 116 students
who took the final and had nonzero TP scores,
and had also earned 1100 or more HW points, the
final exam average is
23.52 out of 40, or 58.8%.
exam grades
FINAL AVERAGE
116 students took 3 or more MC parts, and 3 or more
free response parts, plus the final exam, and
had a nonzero TP score and more than 1100 HW
points.
For those 116 here are the averages:
% points
HW 85.20 11.93
RECITATION 83.78 5.86
(quiz+exercises)
TP 86.80 4.34
test 50.88 27.47
exam 58.79 11.76
_________________________________
overall 61.37 <-- final average
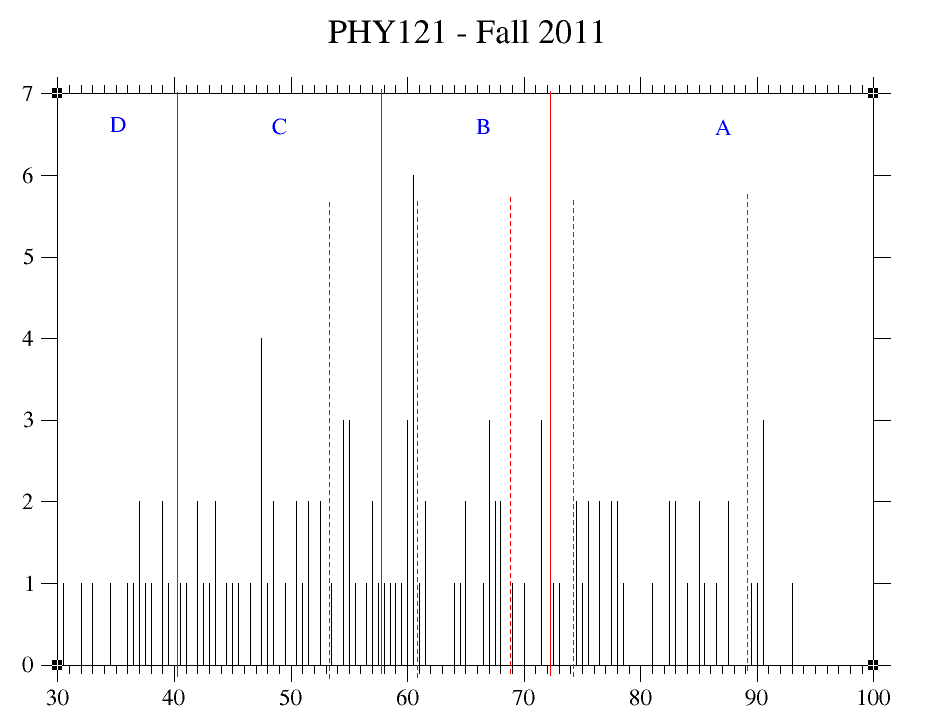
The details of the final grade scale were primarily
determined by the presence of gaps in the grade distribution.
Here is that final grade scale.
below 30.9 E
30.9 - 40.4 D
40.5 - 55.9 C (above 53.9 is C+)
56.0 - 72.8 B (below 61.4 is B-, above 69.1 is B+)
above 72.9 A (below 74.6 is A-, above 89.5 is A+)
Letter grades were assigned strictly according to this
scale. The highest E is 29.3, the lowest D is 31.0; the
highest D is 39.6, the lowest C is 40.5; the highest C
is 55.1, the lowest B is 56.0; the highest B is 71.9,
and the lowest A is 72.9. The smallest gap between
levels is 0.9 points between D to C and also between
C to B.
If you find a significant error in your recorded grades,
contact your TA by email. At this point, any change will
require that we fill out a change-of-grade form. For
information on how to figure your final grade see
HOW TO FIGURE YOUR FINAL GRADE.
Here is the final grade distribution for the 116 students
who took three or more MC and free-response test parts plus
the final exam, and had nonzero TP scores, and received
more that 1100 HW points.
You may also view this column of grades as a text file.
121 grade distribution

You may also like to look at the Spring 2010 Class Averages.