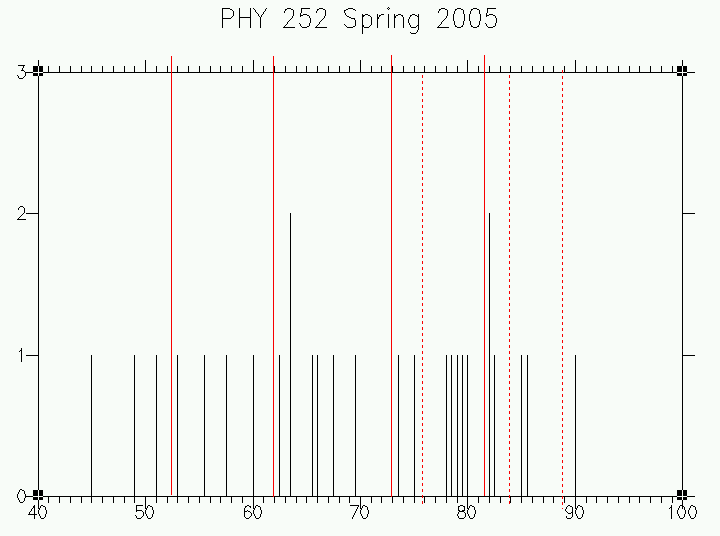
1st test

           31 students took test 1

       for those 31 the average was 59.1

       test 1 grades


2nd test

           28 students took test 2

       for those 28 the average was 53.8

       test 2 grades

3rd test

          29 students took test 3

       for those 29 the average was 50.8

       test 3 grades

4th test

          27 students took test 4

      for those 27 the average was 60.3

       test 4 grades

5th test

          24 students took test 5

       for those 24 the average was 63.7

       test 5 grades


The Pre-Exam Average is now available.

FINAL EXAM

      25 students took the final exam.  For those 25 students
      the final exam average is

            22.92 out of 40, or 57.3%.

       final exam grades

FINAL AVERAGE

 24 students took 4 or more tests plus the final exam
    and had more than 600 HW points (there were 2 students
    who might have passed but chose not to take the final
    exam, and one student who had less than 600 HW points
    who chose to take the final exam).

       for those 24 here are the averages:

                     %     points

      PRS          91.910    2.757

      LAB          91.100   18.220

      HW           90.642   10.877

      TEST         64.198   32.099

      EXAM         57.395    8.609
 __________________________________

   overall                  72.562 (out of 100) <== Final Average

Using this as the final average did not quite seem fair for
this small class, as the overall average would likely have
been lower had the other two students taken the final.  If
I include their pre-exam averages, then for 26 students
we have an overall average of 71.25.  If I include their
post-exam averages, then for 26 students we have an overall
average of 70.61.  If I include all 25 students who took the
final, plus the post-exam averages of the two students who
did not take the final, then we have an overall average of
69.89.  In the end, I was most influenced by the distribution
shown below.  The final grade scale was selected so as to find
gaps in this grade distribution, and to give what I felt was
just credit for lots of hard work done on HW's and LABS.
Here is that final scale:

        52.3 - 62.2   D
        62.3 - 72.2   C   (no C+'s this year)
        72.3 - 82.2   B   (below 77 is B-, no B+'s this year)
        82.3 and up   A   (below 85 is A-, above 90 is A+)

Letter grades were assigned strictly according to this
scale.  The highest E is 51.3, the lowest D is 53.4;  the
highest D is 60.3, the lowest C is 62.9;  the highest C
is 69.7, the lowest B is 73.6;  the highest B is 80.5,
and the lowest A is 82.3.  The smallest gap between
levels is 1.8 points between B to A.  I do not consider this
choice of scale to be a precedent-setting decision as this is
the first time I have taught this class; but in my opinion
is a just scale for this semester.

    Be sure to check my computation of your final grade.
If you find a significant error the best time to see me is
Thurday May 13 between 2:00 - 4:00 PM.  After that time any
change may require that we fill out a change-of-grade form.
For information on how to figure your final grade see

              HOW TO FIGURE YOUR FINAL GRADE.


Here is the final grade distribution for the 25 students
who took the final exam, plus the two students who chose
not to take the final.

You may also view this column of grades as a text file.
 252 grade distribution
