5/12
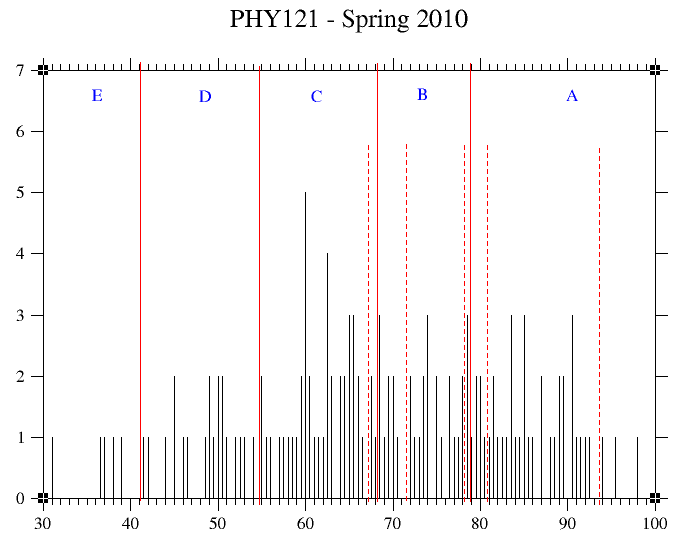
       Here is the final histogram.  In the histogram, solid
       lines indicate the major separations (for example,
       C+/B-).  Dotted lines indicate the minor separations
       (for example B-/B).

       The final overall class average is 68.88.
       Thanks for a great semester. GBA

       For more detail, see the Column of Overall Grades.

5/06

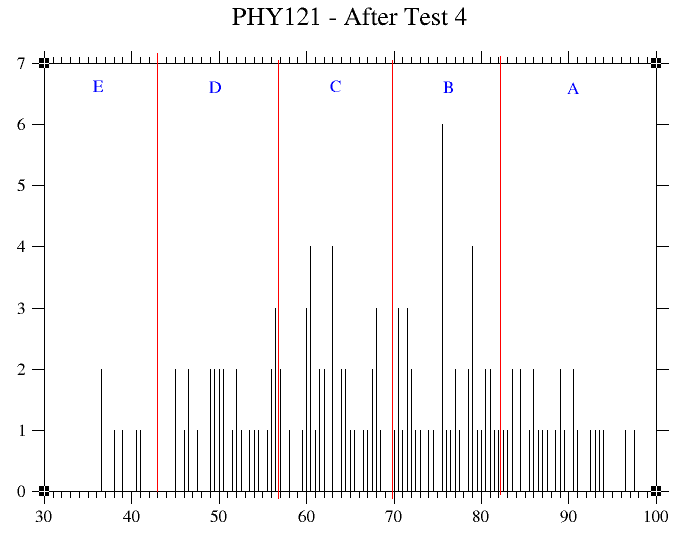
       Here is a histogram of the scores of still-active
       students who have nonzero CPS grades and total HW
       points of 665 or more in my online gradebook.  The
       red lines will give you some idea of what your final
       letter grade cutoffs might be.  As of 5/6, these
       overall scores should be reasonably similar to the
       final overall averages; however, the final exam is
       not yet included.

       The overall class average at this time is 68.25
       (this includes only those students who took Test 4).


                           DISCLAIMER

       The average letter-grade cutoffs shown here are only
       an estimate of the final letter-grade cutoffs.  The
       final selection of cutoffs takes into consideration
       the final class average and is generally primarily
       determined by the location of large gaps in the final
       distribution of overall averages.  The final cutoffs
       may be EITHER HIGHER OR LOWER than those shown here.
       Also, the plus-minus system will be used in the final
       cutoffs, but I will not estimate the location of those
       plus-minus cutoffs.

4/22

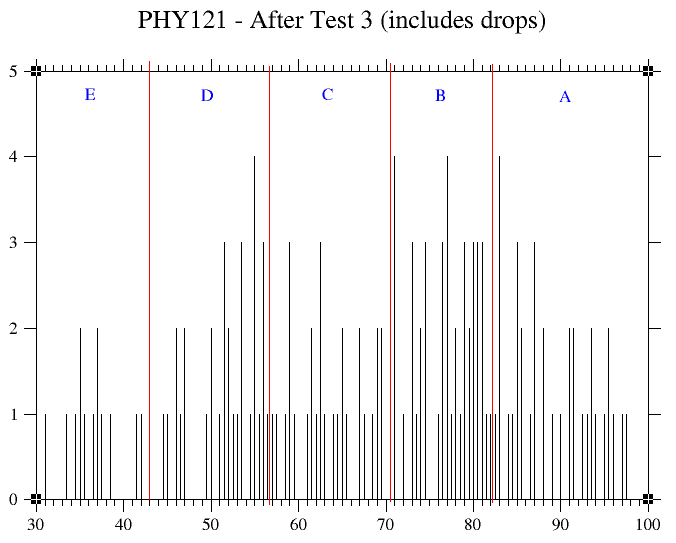
       Here is a histogram of the scores of still-active
       students who have nonzero TP and MP grades in my
       online gradebook.  The red lines indicate an
       ESTIMATE of the approximate locations of the E-D,
       D-C, C-B, and A-B cutoffs for this semester.

       The overall class average at this time, with
       test drops now included, is 67.5.  The final
       average should be a little lower than this average,
       because in the end each student gets one drop out
       of four tests instead of one drop out of three.

                           DISCLAIMER

       The average letter-grade cutoffs shown here are only
       a rough estimate of the final letter-grade cutoffs.
       The final selection of cutoffs takes into consideration
       the final class average and is generally primarily
       determined by the location of large gaps in the final
       distribution of overall averages.  The final cutoffs
       may be EITHER HIGHER OR LOWER than those shown here.
       Also, the plus-minus system will be used in the final
       cutoffs, but I will not estimate the location of those
       plus-minus cutoffs.

4/01

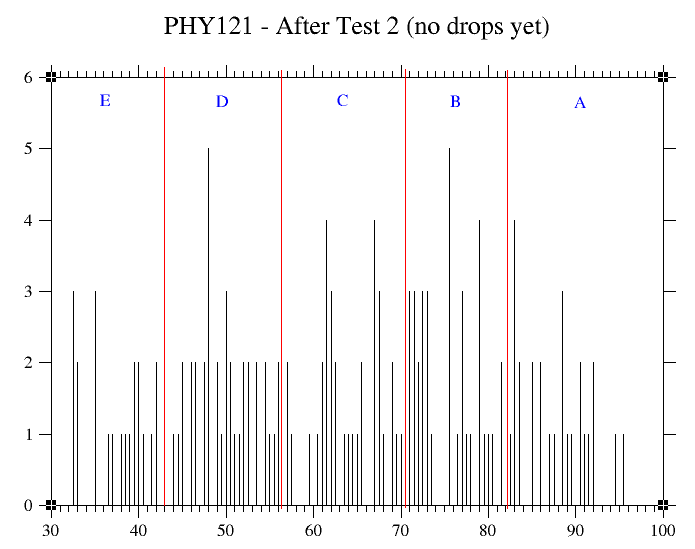
       Here is a histogram of the scores of still-active
       students who have nonzero TP and MP grades in my
       online gradebook.  The red lines indicate an early
       estimate of the approximate locations of the E-D,
       D-C, C-B, and A-B cutoffs for this semester.  As
       of 4/01, these estimates are unreliable, since
       no test drops have yet been included in the average
       calculations; all averages will rise once the test
       drops have been included.  Another histogram will
       be posted after Test 3; at that time, test drops
       will be included.

       The overall class average at this time, with no
       test drops yet, is 63.4.


                           DISCLAIMER

       The average letter-grade cutoffs shown here are only
       a rough estimate of the final letter-grade cutoffs.
       The final selection of cutoffs takes into consideration
       the final class average and is generally primarily
       determined by the location of large gaps in the final
       distribution of overall averages.  The final cutoffs
       may be EITHER HIGHER OR LOWER than those shown here.
       Also, the plus-minus system will be used in the final
       cutoffs, but I will not estimate the location of those
       plus-minus cutoffs.


