NOTE: In reporting the averages from the test we drop
the lowest scores. This is because 16.7% (1 out
of 6) of all scores will eventually be dropped.
In comparing your average with the class average
you need to compare with an average which is
representative of the final average. Dropping
the lowest scores before reporting the average
is one way of ESTIMATING the effect of the
final drops. These posted averages are not
used in any way in calculating the final class
average. GBA
1st test
40 students took test 1
Multiple Choice
31 students earned 20 or more points
for those 31 the average was 34.6 (57.7%)
Problems
21 students earned 16 or more points
for those 21 the average was 26.9 (44.8%)
multiple choice grades problem grades
2nd test
39 students took test 2
Multiple Choice
28 students earned 22 or more points
for those 28 the average was 33.0 (55.0%)
Problems
28 students earned 15 or more points
for those 28 the average was 28.36 (47.3%)
multiple choice grades problem grades
3rd test
Because one half of one test can be dropped, many
students choose not to study as seriously for Test 3
as they study for Tests 1 and 2. As a result, we
report the averages only for those students who keep
the relevant half of Test 3. GBA
35 students took test 3
Multiple Choice
24 students did not drop Test 3 MC
for those 24 the average was 25.0 (41.7%)
Problems
29 students did not drop Test 3 Problems
for those 29 the average was 24.5 (40.8%)
multiple choice grades problem grades
Overall averages
35 students took three tests and had at least
112 homework points
for these 35 students
the final CPS average is 4.26 points (out of 5)
the final HW average is 6.77 points (out of 8)
the final quiz average is 5.20 points (out of 7)
the final test average is 35.30 points (44.12% of 80)
the overall average is 51.5 points
Note that the overall average includes all students who took
three tests and who had at least 112 HW points. The test
average is computed by dropping the lowest MC or problem
section for each student, computing each student's average,
and then computing a global average for all 35 students.
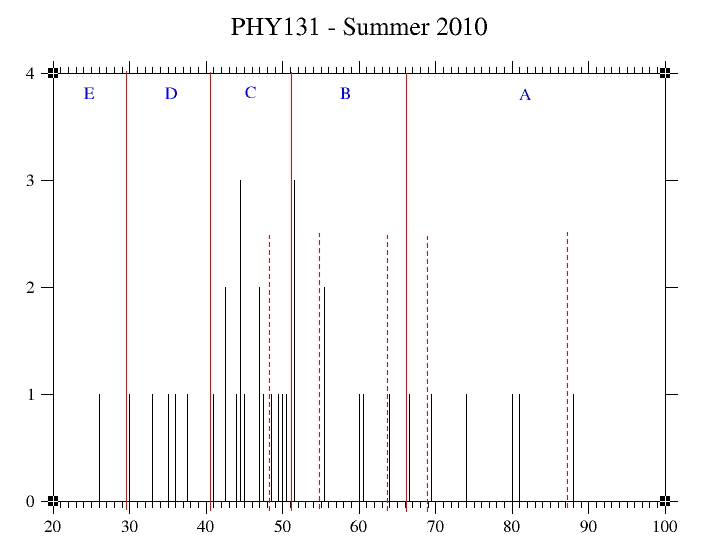
With this final average, the final grade scale is
30.2 - 41.3 D
41.3 - 51.6 C (above 48.6 is C+)
51.7 - 66.8 B (below 55.6 is B-, above 64.0 is B+)
66.9 and up A (below 69.7 is A-, above 88.2 is A+)
with below 30.2 as E. The final scale was selected so as to
find gaps in the distribution. With the scale as given above
the highest E is 26.5, the lowest D is 30.2, the highest D
is 37.7, the lowest C is 41.3, the highest C is 50.9, the
lowest B is 51.7, the highest B is 64.1, and the lowest A
is 66.9. The smallest gap is 0.8 points between C and B.
Grades were assigned strictly based on this scale.
If you find a significant error in the recording of your
grades, or in my computation of your final grade, please
contact me before 1 PM TUE Aug 10. For information on how
to figure your final grade see
HOW TO FIGURE YOUR FINAL GRADE
Here is the grade distribution for those 35 students:
You may also view the grades as a text file: 131 grades

You may also compare with Summer 2009 Averages

Thanks again for a good summer class.  GBA