| Statistics with single list of data points each with frequency 1 | Statistics with data points from a frequency distribution |
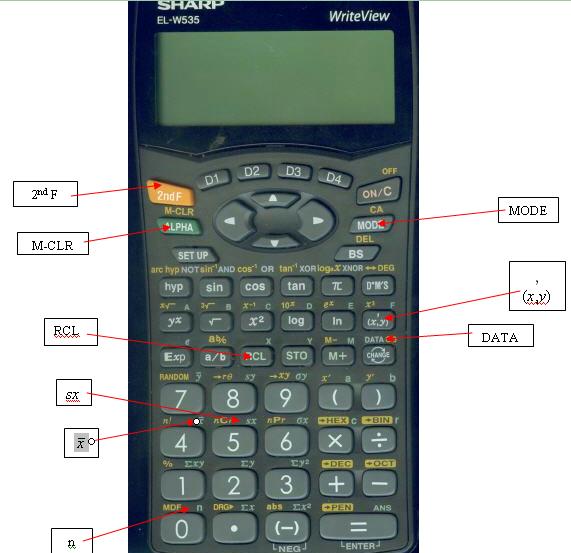
| Get into statistics mode: Press  (you will see <MODE> (you will see <MODE>  Press 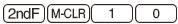 Enter the data: Press first data number Press  You will see DATA SET=1 at the bottom of the screen. Press second data number Press You will see DATA SET=1 at the bottom of the screen. Continue until you have entered all the data and have DATA SET=# where # is the total number of data points. Calculating mean and standard deviation Press the   (above ) = to see the number of total
data points. (above ) = to see the number of total
data points.Press the  (above (above  ) to see the mean ) to see the meanPress the |
Get into statistics mode: Press (you will see <MODE> Press Enter the data points: Press first data number Press  Press the number in the frequency column Press You will see n=1. Press second data number Press Press the number in the frequency column Press You will see n=2. Continue until you have entered all the data and have n=# where # is the number of the different values you put in. Calculating mean and standard deviation Press the ) = to see the number of total
data points.Press the Press the |