The Nearby Field Galaxy Survey
Rolf A. Jansen1,2 & Sheila J. Kannappan2
1 Kapteyn Astronomical
Institute, Groningen, The Netherlands
2 Harvard-Smithsonian Center
for Astrophysics, Cambridge, USA
jansen@astro.rug.nl, sheila@cfa.harvard.edu

Poster Abstract
In this poster paper we report on our observing programme to obtain
integrated spectrophotometry, intermediate and high resolution major
axis spectra, and UBR surface photometry of a representative
sample of ~200 galaxies in the nearby field. The main goal of this
programme is to provide a comparison sample for high redshift studies
and to study the variation in star formation rates (SFR), star formation
history (SFH), excitation, metallicity, and internal kinematics over a
large range in galaxy luminosity and morphological type. In particular,
we extend the work of Kennicutt (1992) to lower luminosity systems.
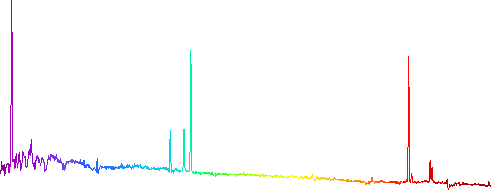
Here, we present two atlases: one of images and radial surface
brightness- and colour profiles (left
panel), another of images and integrated spectra (right panel). Furthermore, we present the main
results of our analysis sofar (middle panel). Each of the separate
panels can be accessed directly by clicking on the appropriate region in
the poster miniature above.
Background

Some background - the problem
As galaxies are now routinely sampled at fainter magnitudes and higher
redshifts than ever before, one of the major problems with the
interpretation of distant spectroscopic data has become the difficulty
of obtaining good comparison samples in the local universe. Distant
galaxies subtend a small angle on the sky and their spectra are
unavoidably integrated spectra, while most spectra of nearby galaxies
are nuclear spectra only. A direct comparison of distant and nearby
galaxy spectra, therefore, is difficult.
In a pioneering effort, Kennicutt (1992) obtained integrated
spectrophotometry for 90 galaxies spanning the entire Hubble sequence.
His study has been a benchmark for the interpretation of spectra at both
high and low redshift. The range in luminosity sampled per type,
however, was limited to the brightest galaxies, and no uniform surface
photometry nor internal kinematical data is available. Also, only 44
out of 90 galaxies were observed at intermediate spectral resolution
(5–7 Å), the remainder at lower resolution (15–20
Å). Large homogeneous samples of intermediate or high
resolution nuclear and integrated spectrophotometry, supplemented by
multi-filter surface photometry, for galaxies spanning the entire Hubble
sequence and with a large range in luminosity, are absent in the
literature to date.

The Nearby Field Galaxy Survey - the solution
With our Nearby Field Galaxy Survey (NFGS) we aim to remedy this
situation. The purpose of our study is to obtain integrated and nuclear
spectrophotometry over the entire optical regime, as well as U,B,R,
H and K' surface photometry, and high resolution
spectroscopy, for a sample of 196 galaxies in the nearby field,
including galaxies of all types and spanning a large range in
luminosity. With "field" we imply a selection that includes galaxies in
clusters, groups an low density environments, as opposed to a selection
favoring any single one of these.
The data will be used to study the emission and absorption line
strengths, star formation rate and star formation history, morphologies,
structural parameters, colours, magnitudes and internal kinematics of
gas and stars, both globally and as a function of radius within a
galaxy. We thus aim to extend the work of Kennicutt to lower luminosity
galaxies accross the Hubble sequence and to study the variation in
galaxy properties over a large range in absolute magnitude and type.
The data can be used as a benchmark for galaxy evolution modelling and
comparison with observations of high redshift galaxies, as will result
from future observations with large ground-based telescopes and the
NGST.

Selecting the sample
The 196 target galaxies in this survey have been objectively selected
from the CfA redshift catalog (CfA I, Huchra et al. 1983) to span the
full range in absolute B magnitude present in the CfA I (−14
< MB < −22), while sampling fairly the
changing mix of morphological types as a function of luminosity. Absolute
magnitudes were calculated directly from blue photographic magnitudes and
radial velocities in the Local Group rest-frame, assuming H0 = 100
km s-1 Mpc-1.
To avoid a sampling bias favoring a cluster population we excluded
galaxies in the direction of the Virgo Cluster with velocities smaller
than 2000 km/sec. We also minimized the number of galaxies larger than
3 arcmin (the slit length of the FAST spectrograph) by imposing a
luminosity dependent lower limit on the radial velocity. Thus, we do
not impose a strict diameter limit, while avoiding selecting the
nearest high luminosity galaxies (which tend to be the largest on the
sky). We sorted the 1006 galaxies remaining after our Virgo Cluster and
radial velocity cuts into 1 magnitude wide bins of absolute magnitude,
which in turn were sorted according to Hubble type. We then drew from
each bin a number of galaxies chosen to approximately reproduce the
local galaxy luminosity function, while preserving the mix of
morphological types in each luminosity bin. The total number of
galaxies selected is 196, with a median redshift of 0.01 and a maximum
redshift of 0.07 . Only 8 of these have major axis optical diameters
larger than the slit length.
With very few caveats this sample can be considered a fair
representation of the local galaxy population.
Observations

UBR surface photometry
The photometric observations were obtained at the FLWO 1.2 m telescope,
on Mt.Hopkins, Arizona, during 50 dark nights between 1994 March and
1997 March. U filter images were obtained with a thinned
backside illuminated CCD, while most B and R images
were obtained with an older camera and a front illuminated CCD.
Typically, we exposed 2 × 450, 2 × 900 and 1 × 900 seconds
in R, B, and U. Limiting surface brightnesses average
µR=26.1,
µB=27.2,
and µU=26.7
mag/arcsec2.
Radial surface brightness profiles were extracted using an ellipse
fitting procedure where center, position angle and ellipticity were
fixed at all radii to the average values in the outer parts. Total,
effective and isophotal magnitudes were calculated from the radial
surface brightness profiles. Tests of the internal and external
accuracy of our photometry indicate typical errors of 0.02 mag and 0.05
mag for isophotal and total magnitudes, respectively.

Spectrophotometry
Integrated and nuclear spectra were obtained with the FAST spectrograph
at the FLWO 1.5 m telescope during 41 nights between 1995 March and 1997
March. The 2720 × 512 pixel thinned CCD of the FAST in combination
with a 300 l/mm grating allowed coverage of the entire near-UV through
optical range (3500–7250Å) in a single exposure, at a resolution
(FWHM) of ~6Å. We approximately aligned the spectrograph slit with
the major axis of each galaxy. The integrated spectra were obtained by
drift scanning the slit over a total distance of half the minor axis
optical diameter and extracting over 0.7 times the major axis optical
diameter. Thus, on average, we sample over 80% of the total galaxy
light.
Based on tests of the internal and external accuracy of the data (see
fig.7), we claim an overal relative spectrophotometric accuracy of 6%.

Soon to come... internal kinematics
Kannappan, Fabricant and Franx have obtained high resolution spectra in
the range 6000–7000Å (emission line galaxies) at a resolution
(FWHM) of 1Å, and in the range 4000–6000Å (no or relatively
little emission) at a resolution (FWHM) of 2.3Å. Rotation curves
were derived from the former by simultaneously fitting the wavelengths
of Hα, [N II], [S II] and
[O I] lines as a function of radius in a galaxy.
Velocity dispersions were fit using a velocity broadened stellar template
and a Fourier fitting algorithm in the latter spectra.
The main goals of these measurements are to study galaxy mass profiles
as a function of morphological and spectrophotometric properties, to
compare gas and stellar kinematics, and investigate kinematic evidence
of galaxy interactions, mergers and mass infall.

Work in progress: H and K photometry
Pahre, Jansen, Kannappan, Fabricant & Willner are obtaining
H and K filter photometry for the NFGS galaxies to
determine the relative contributions of spheroids and disks to the
luminosity density of the local universe. Near-infrared data for half
of the sample is now available.
Previous measurement of this parameter (Schechter & Dressler 1987)
relied on visual total magnitude and bulge estimates from photographic
plates and suffered from relatively poor knowledge of the luminosity
functions of different morphological types. Combination of U,B,R,
H and K photometry and our spectrophotometry will allow a
better separation of age and metallicity effects, as well as internal
extinction, while inversion of our selection and comparison with a
deeper complete spectroscopic sample (Carter et al. (in prep.)) allows
us to infer volume densities as a function of type and luminosity.
Results

UBR surface photometry
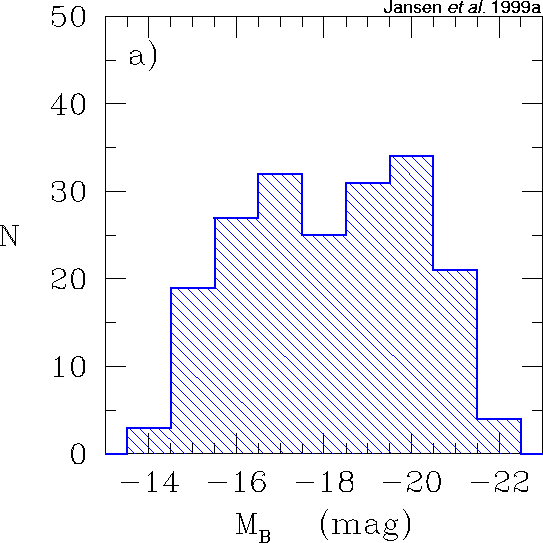
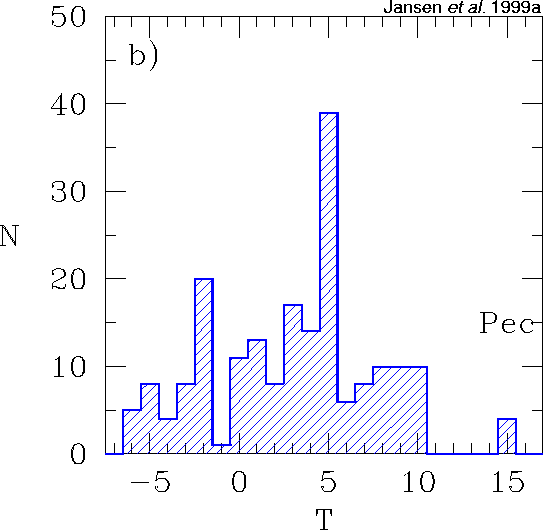
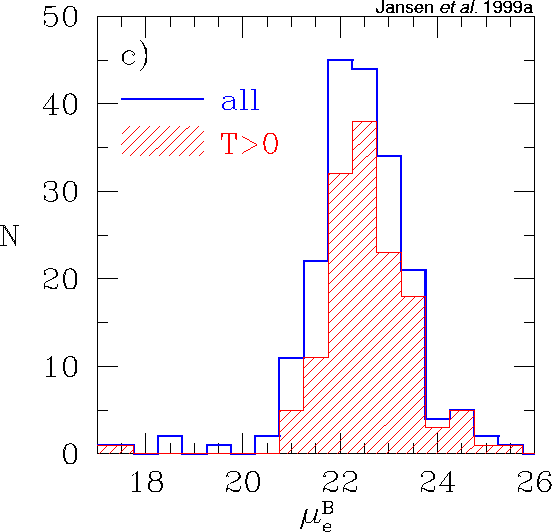
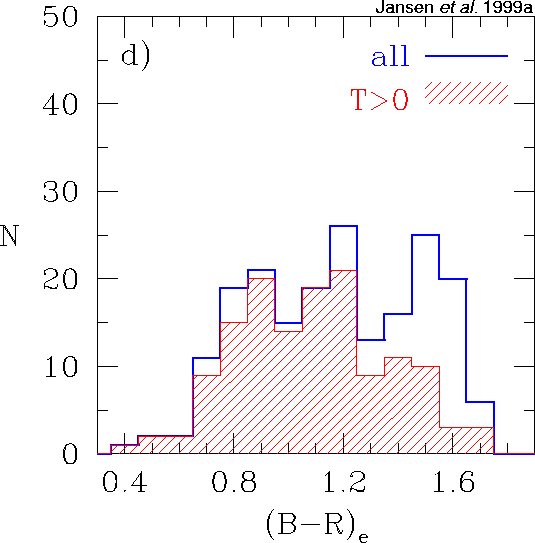
Figure 1: Overview of the global properties
of the selected galaxy sample. Presented are the number distributions as
a function of:
a) absolute B magnitude; b) galaxy type (note that we choose to place
the unclassified early type galaxies at T=−4 (cD) rather than −7,
as we do not have any cD galaxies in our sample, and this placement seems more
natural with respect to the compact ellipticals at T=−6); c) the surface
brightness at the effective radius in B; and d) the effective
(B−R) colour, measured within the effective radius in B.
In panels c) and d) the open (blue) histograms represent the selected
sample, and the shaded (red) ones the subsample of galaxies with types
later than S0/a.
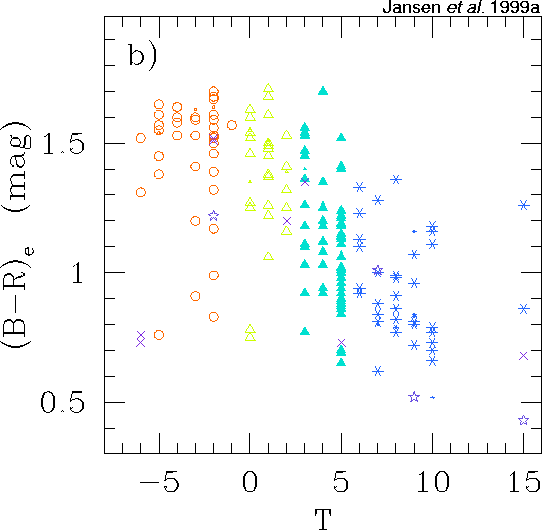
We observe a strong trend of (B−R)e color with
morphological type, with later type galaxies becoming progressively
bluer (Figure 2). The observed scatter on this trend is 0.19 mag, which
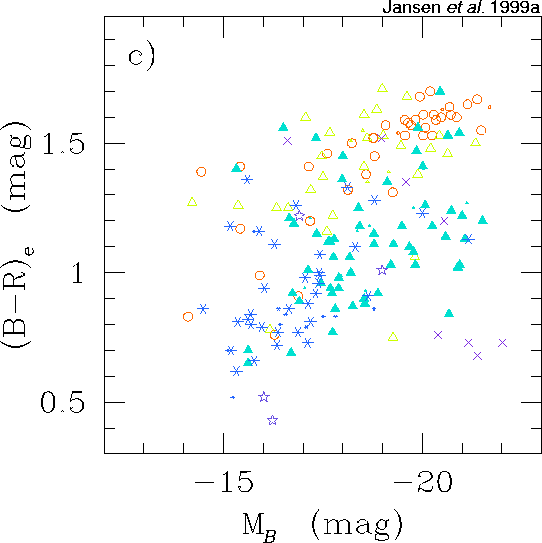
is smaller than the 0.24 mag scatter on the color–magnitude trend where
intrinsically fainter systems tend to be bluer than brighter systems.
Estimating a galaxy's broad type class (E,S,Irr) from its color can,
therefore, be as accurate as estimates based on galaxy asymmetry and
central concentration of the light (Abraham et al. 1996).
We find that color–magnitude relations are useful for early type
systems and to a lesser degree for very late type systems, but not
useful for intermediate type spirals.
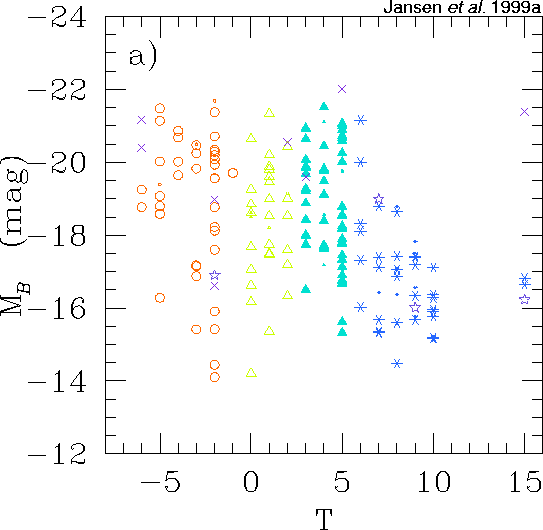

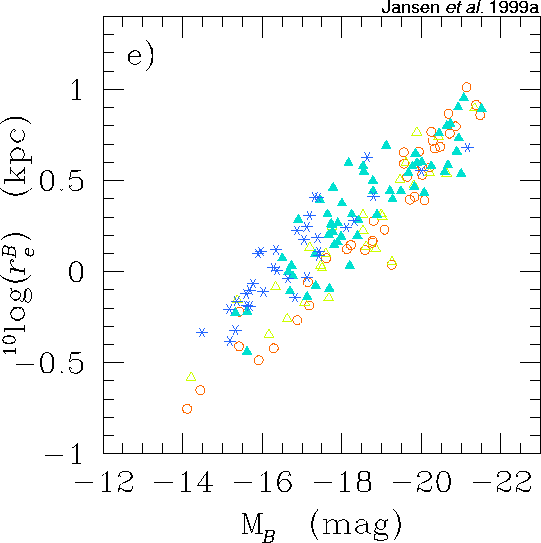

a) Total absolute B magnitudes as a function of type. Apart from the group of faint early type galaxies, the well-known trend of luminosity with type – later type galaxies get progressively fainter – is evident.
b) Effective (B−R) colours as a function of type. Galaxies become progressively bluer towards later types.
c) Effective (B−R) colours versus total absolute B magnitude. Brighter galaxies tend to be redder.
d) Colour-colour plot of effective (U−B) versus (B−R) colours. Apart from the active ones, the galaxies lie on a tight relation. Note that this is the first such plot for a sample so diverse in properties. The interstellar extinction vector is indicated.
e) Effective radii in B versus absolute B magnitude. Apart from the trivial relation between galaxy size and luminosity, we find a clear separation in type at a given magnitude for MB > −19. Lower surface brightness galaxies lie above the mean relation for a given absolute magnitude and given type.
f) Effective R-filter surface brightnesses measured within the effective radii in B as a function of type. Among the spirals a clear trend towards fainter central surface brightnesses going to later types is visible.
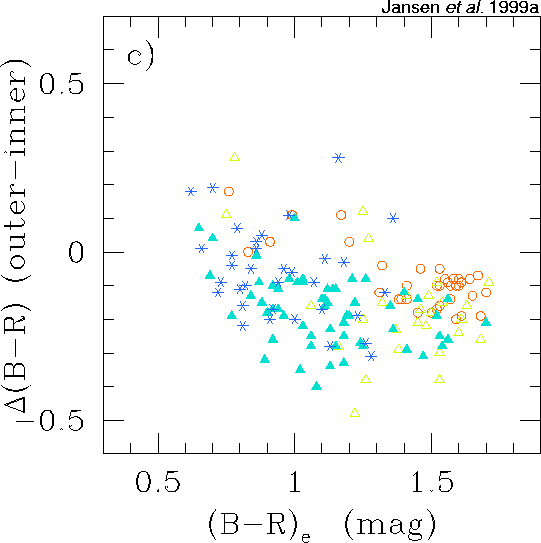
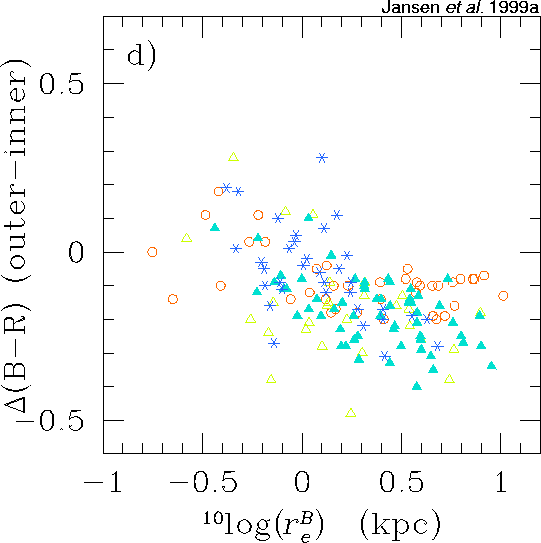
We also verify the result of Tully et al. (1996), that the faintest galaxies may become redder with radius instead of bluer. Star formation is the driving force in this trend (Jansen et al. 1999a).
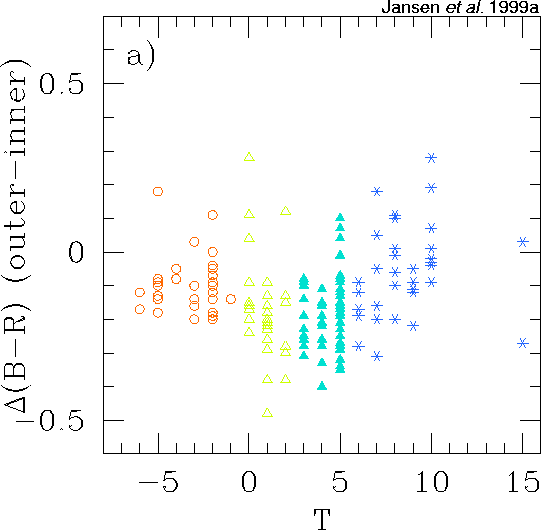

a) Colour difference Δ(B−R) as a function of type. The disappearance of a significant bulge going from early type spirals towards later types causes the strong trend for T>0.
b) Colour difference Δ(B−R) as a function of total absolute B magnitude. Note that the galaxies fainter than MB~−16 are equally likely to become redder with radius as they are to become bluer. c) Colour difference versus effective (B−R) colour. Only a small majority of the galaxies showing a reddening trend with radius is blue.
d) Colour difference versus effective radius in B. Galaxies showing a reddening trend with radius are intrinsically small systems.

Spectrophotometry
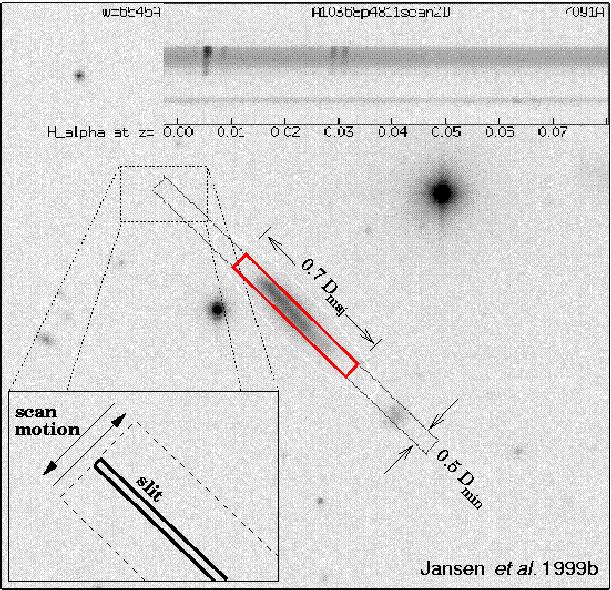
Figure 4: An example of the geometry of the periodic driftscan to obtain integrated spectra. The total distance over which the slit is moved back and forth is half the blue minor axis optical diameter. This distance was chosen to match the expected surface brightness limit of the 1.5 m telescope and FAST spectrograph. The spectra were extracted into 1-D spectra using an objectively defined aperture of size 0.7 times the major axis diameter at µB=26 mag/arcsec2, as determined from our B-filter photometry. The ellipse drawn into the image was fit to the B26 isophote. In the case of galaxy A10368+4811, we sample ~80% of the light within this isophote, or 68% of the total galaxian light.
The bluing of galaxies towards both later morphological types and lower luminosities is apparent in the spectrum continua as well. Moreover, the emission line strengths increase with respect to the continua going to lower luminosity systems. This trends is most apparent for the intermediate type spiral galaxies, but can be seen all accross the Hubble sequence.
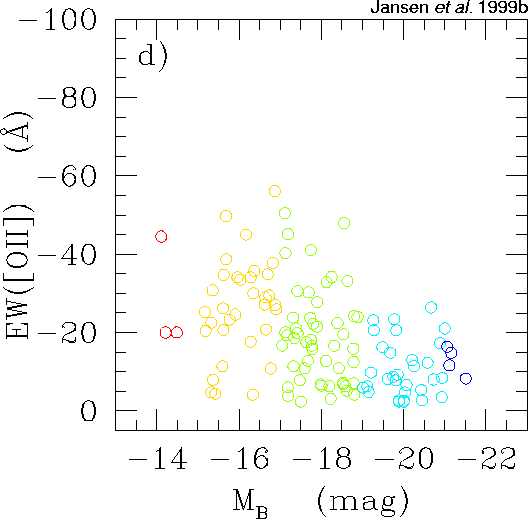
Of particular interest is the relative strength of the [OII]3727Å line with respect to Hα, as [OII] is the strongest line available in the optical regime for galaxies with 0.3 < z < 1 and has been widely used as a tracer of the SFR. The fainter galaxies tend to have [OII] in excess of the relation found by Kennicutt (1992), corresponding to EW([OII]) ~ 0.6 EW(Hα). Preliminary analysis indicates that this must be attributed to a combination of (1) a higher average excitation temperature in the ISM of faint galaxies — which in turn is due to their lower metallicities — which boosts the strenght of [OII] relative to the Balmer lines over a large range in temperature, and (2) a lower interstellar extinction or smaller filling factor of obscuring matter than derived for high luminosity systems.
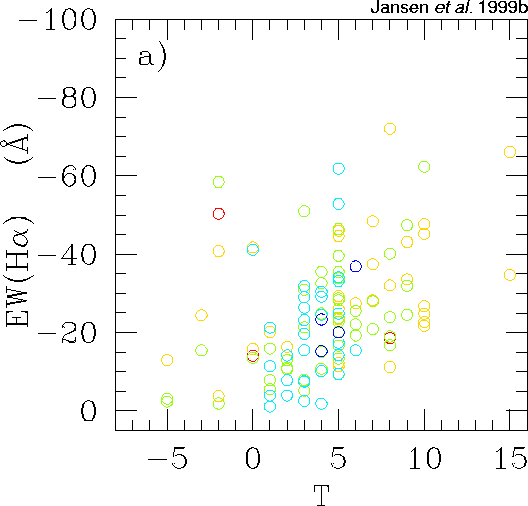
a) Hα equivalent width versus type. Apart from the trend towards larger EWs going to later types, a number of early type galaxies shows significant emission as well. These systems are all fainter than the characteristic absolute magnitude, M*~−19.
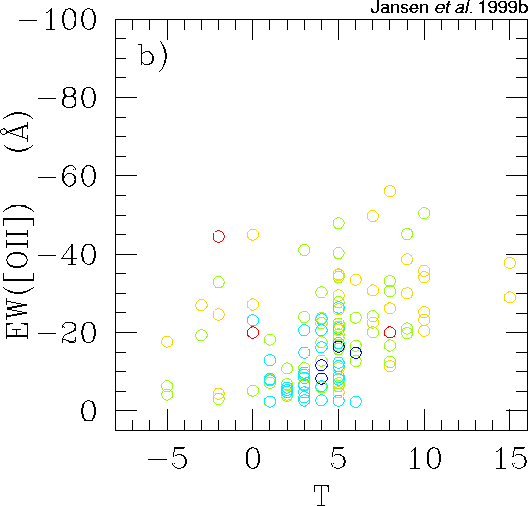
b) Similar for [OII]3727Å emission.
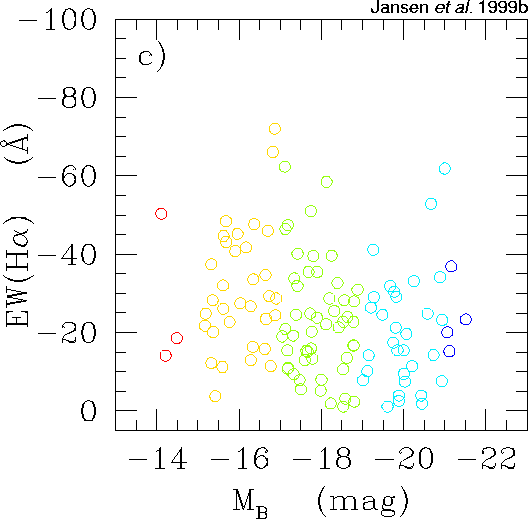
c) Hα equivalent width versus absolute B magnitude. No clear trend with luminosity is seen, although a hint of an increase in EW(Hα) in the fainter systems is visible.
d) Similar for [OII]3727Å emission. Although galaxies with faint emission lines can be of any luminosity, there is a strong preference for the systems with strong [OII] lines to be of lower luminosity, i.e., the upper envelope of EW([OII]) depends on luminosity.
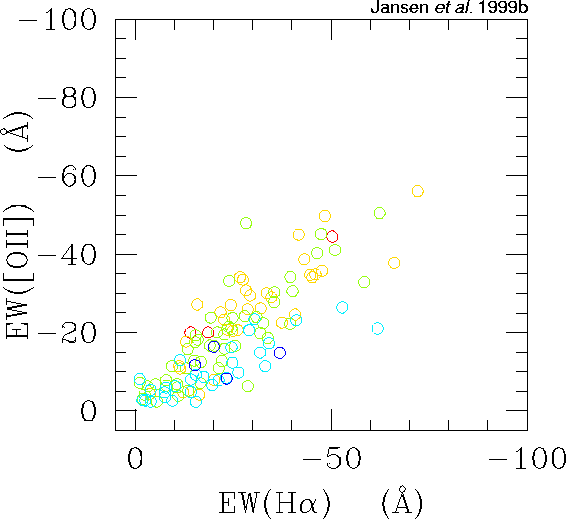
Figure 6: [OII]3727Å equivalent width versus Hα equivalenth width. Symbol colours are as in figure 5. High luminosity galaxies follow the relation found by Kennicutt (1992), while galaxies fainter than MB~−19 tend to follow a much steeper relation. In the lowest luminosity galaxies, EW[OII] approximates EW(Hα).
We find (preliminary analysis) that this effect can be attributed in equal parts to the higher average excitation temperature in lower luminosity galaxies (which tend to have lower metallicities than higher luminosity galaxies), and to the internal extinction by interstellar dust, which we find to be somewhat smaller than inferred from broadband colours.
This discovery has implications for star formation rates at higher z that have been inferred from [OII]3727 or UV continuum. Worst case scenarios indicate that such measurements might overestimate the true star formation rates by up to a factor 2.
These findings add to the work by other authors (e.g., Hammer
et al. 1997; CFRS) and show that the excess strength
of [OII]3727 with respect to Hα is not restricted
to higher redshifts.

Figure 7: Comparison of photometric and synthetic spectrophotometric broadband (B−R) colours.
One potent test of our external spectrophotometric accuracy is the comparison of synthetic broadband colours with the broadband colours of the photometric part of this survey. Apart from a small offset in zeropoint of 0.068 mag, the synthetic colours reproduce the photometric colours to within 0.06 mag (RMS) over the full range in galaxy colours available in the NFGS sample. This implies that our relative spectrophotometry should be accurate to ~6% over the range 3700–7200Å.
(Note that part of the remaining scatter of the individual points is due to the inexact match of the spectroscopic and photometric apertures).
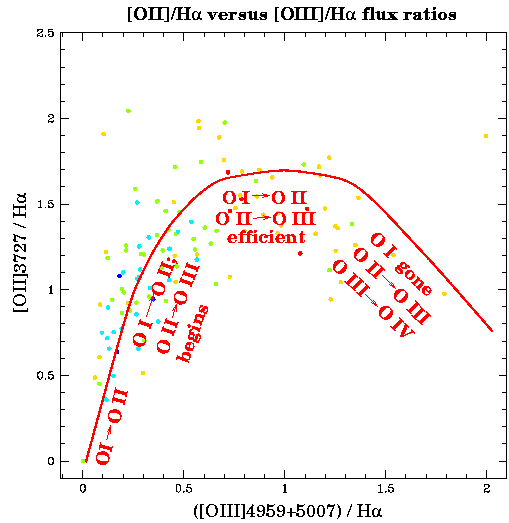
Figure 8: Preliminary measurements of the average excitation state of the interstellar gas using the integrated spectra.
High luminosity galaxies show predominantly low excitation states, while a significant fraction of the low luminosity galaxies show high excitation states. The excitation state in these plots is indicated by the relative contributions of single and double ionized oxygen emission lines. The excitation track indicated is only a schematic representation.

Internal kinematics
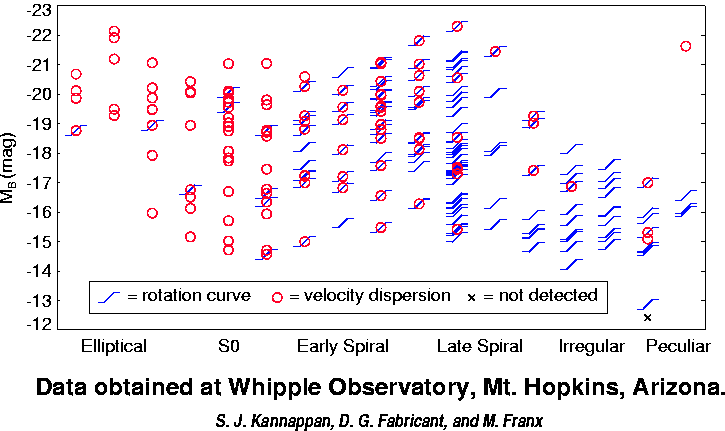
Figure 9: Overview of high resolution
spectroscopic data obtained with the FAST spectrograph at the 1.5 m
telescope of the F.L. Whipple Observatory, Mt.Hopkins, Arizona.
The NFGS sample galaxies have been ordered according to morphological
type and per type according to their absolute B filter
magnitude.
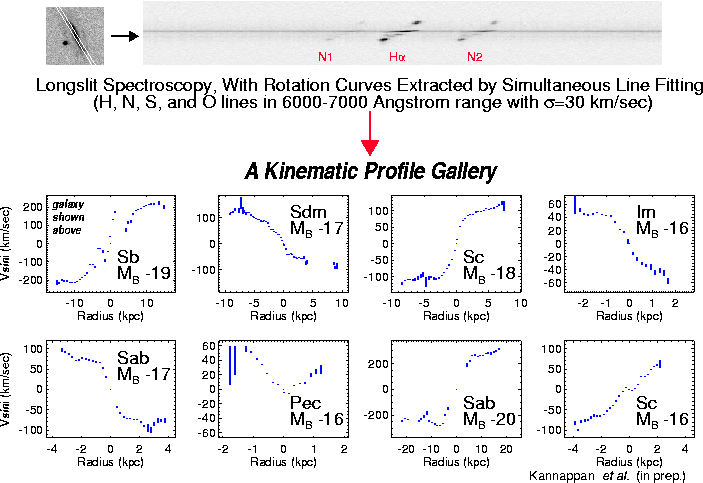
Figure 10: Gallery of several example optical rotation curves.
At top left, a greyscale B-filter image is given for one galaxy with the orientation of the spectrograph slit indicated. The resulting 2-D spectrum image, spanning the range 6000–7000Å in wavelength, is presented with the strongest emission lines marked.
The extracted rotation curve for this galaxy is presented in the upper left panel of the gallery, showing that this galaxy is similar in size luminosity and mass as our own Milky Way galaxy.
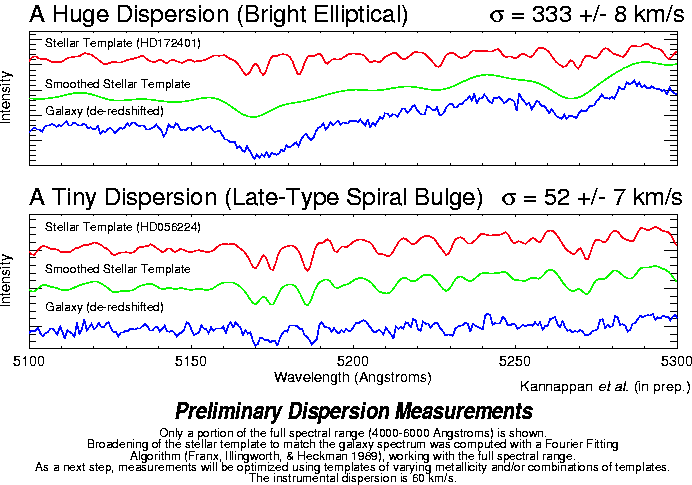
Figure 11: Two examples of measured velocity dispersions, for a bright elliptical (top; dispersion of 333 km/s), and the bulge of a late-type spiral galaxy (bottom; dispersion of 52 km/s). Clearly visible in both cases are the stellar absorption lines of Mg I (5167,5173 & 5184Å) and Fe I (5269Å).
Making full use of the redundancy in the data, by using the entire observed wavelength range of 4000–6000Å in the Fourier fit, allows us to accurately determine the velocity dispersion of even tiny bulges in low luminosity systems. Hence the large fraction of the galaxy sample with both rotation curves and velocity dispersions (see: figure 9).

Galaxy morphology
Following Abraham et al. (1996) we measure galaxy morphology using a simple but quantitative technique. We reduce the image of each galaxy to two parameters: central concentration and rotational asymmetry. The central concentration traces the bulge-to-disk ratio and the asymmetry traces the luminosity weighted deviations from axisymmetry of a galaxy (as can be the result of star formation, intrinsic lopsidedness, and in some cases tidal disruption).Galaxies are, as expected, more asymmetric in bluer passbands. The amount by which galaxies become more asymmetric depends on both galaxy type and colour. The central concentration does not depend significantly on bandpass. Both parameters are sensitive to the cutoff isophote within which the measurement takes place.
A naieve "no evolution" model based on the observed change in asymmetry index A going from R to U, taking into account only the effects due to bandpass shifting, would predict a shift of 0.12 going from z=0 to z=0.5 and 0.19 going from z=0 to z=1.
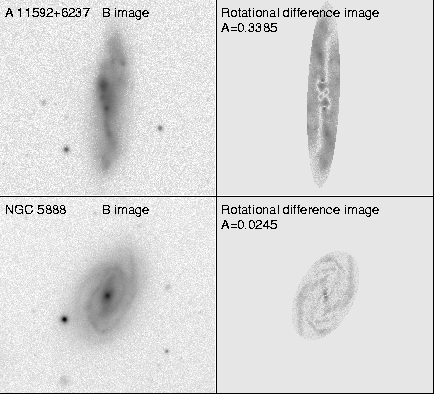
Figure 12: Greyscale renditions of the B filter image and corresponding rotational difference image for a very asymmetric galaxy, A11592+6237, and a very symmetric galaxy, NGC 5888. The value of the measured asymmetry index A is indicated. As can be seen for NGC 5888, a symmetric image does not need to be featureless!

Atlas panels

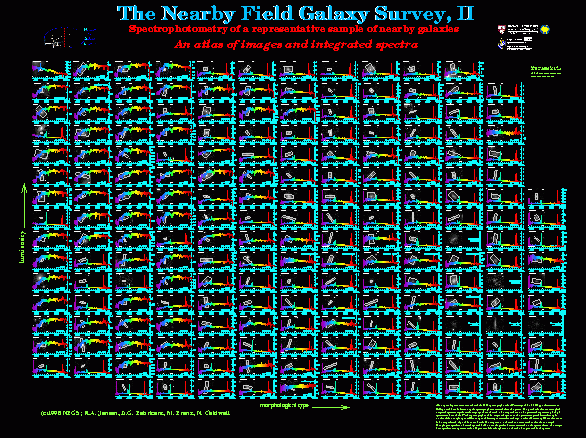
Part of this Mega-poster are two (48x36 inch/120x90 cm) panels presenting the:
1. atlas of images and radial profiles (PDF format, 6.4 Mb)
2. atlas of images and integrated spectra (PDF format 4.8 Mb)
Note the significant sizes of these files!
Caption to atlas 1: The atlas of images and
radial profiles. Greyscale renditions of a B filter image and
the radial dependence of the surface brightness in U,B,R (top
panel) and corresponding colours (bottom panel) are presented for each
of the observed galaxies. The galaxies have been ordered according to
their morphological type from left (early) to right (late) and per type
according to their absolute B magnitude from top (bright) to
bottom (faint). North is up and East is to the left. The original
CCD images were much larger than the portion centered on the galaxies
presented here. The image scale is indicated by a scale bar, 1 minute of
arc in length.
Caption to atlas 2: The atlas of images and
rest-frame integrated spectra. Greyscale renditions of a B
filter image, with the aperture sampled in the spectra overlayed, are
presented for each of the observed galaxies. The spectra were obtained
by drift-scanning the spectrograph slit accross the face of a galaxy
while exposing and span the range 3600–7200Å at a resolution
(FWHM) of 6Å. The galaxies were ordered according to morphological
type and luminosity as in the photometric atlas. The fluxes are
normalized to the flux at 5500Å prior to plotting. On average, the
apertures indicated encompass more than 85% of the blue light contained
within the optical radius of a galaxy.

References
Carter, B., & Fabricant, D.G. (in prep.)
Franx, M., Illingworth, G., & Heckman, T. 1989, AJ, 98, 538
Hammer, F., Flores, H., Lilly, S.J., Crampton, D., Le Fè vre, O., Rola, C., Mallen-Ornelas, G., Schade, D., & Tresse, L. 1997, ApJ, 481, 49 (CFRS XIV)
Huchra, J.P., Davis, M., Latham, D., & Tonry, J. 1983, ApJS, 52, 89 (CfA I)
Jansen, R.A., Franx, M., Fabricant, D.G., & Caldwell, N. 1999a (ApJS, in prep.)
Jansen, R.A., Fabricant, D.G., Franx, M., & Caldwell, N. 1999b (ApJS, in prep.)
Jansen, R.A., Franx, M., Fabricant, D.G., & Caldwell, N. 1999c (Ph.D. thesis, University of Groningen)
Kannappan, S.J., Fabricant, D.G., & Franx, M. (in prep.)
Kennicutt, R.C. Jr. 1992, ApJ, 388, 310
Pahre, M., Jansen, R.A., Kannappan, S.J., Fabricant, D.G., & Willner, S. (in prep.)
Schechter, P.L., & Dressler, A. 1987, AJ, 94, 563
Tully, R.B., Verheijen, M.A.W., Pierce, M.J., Huang, J.-S., & Wainscoat, R. 1996, AJ, 112, 2471

More information on the Nearby Field Galaxy Survey and its results may
be found on the Nearby Field Galaxy Survey
homepage (http://www.public.asu.edu/~rjansen/nfgs/ ) or by contacting one
of the NFGS team members:
sheila@astro.as.utexas.edu, dfabricant or ncaldwell@cfa.harvard.edu,
franx@strw.leidenuniv.nl

Back to the start of this paper.