State Precipitation &
Temperature Update for
Conditions through December
2007
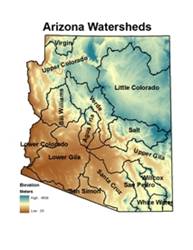
Precipitation
is monitored for the state of
Here, precipitation
percentile values for the most recent month, along with previous 3-, 6-, 12-,
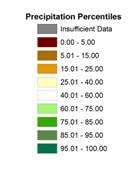
24-, 36-, and 48-month total are shown for each watershed. Low percentile values (brown shading) indicate
dry conditions while high values (green shading) indicate wet conditions. For
example, a precipitation total that falls at the 100th percentile
means that it is the highest precipitation total for the 1971-present period.
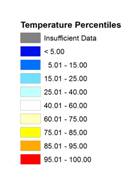
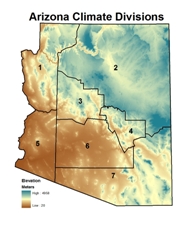 Temperature is monitored for the state of
Here, temperature
percentile values for the most recent month, along with previous 3-, 6-, 12-,
24-, 36-, and 48-month averages are shown for each climate division. Low percentile values (blue shading) indicate
cool conditions while high values (orange/red shading) indicate hot conditions.
For example, a temperature that falls at the 100th percentile means
that it is the highest average temperature for the 1895-present period.
The maps of the seven
periods for precipitation and temperature are shown below, with tables of the
percentile values and descriptive text following the maps. Current update is 01/31/2008. The data are preliminary.
Precipitation Percentiles by Watershed (through
December 2007)
Temperature Percentiles by Climate
Division (through December 2007)
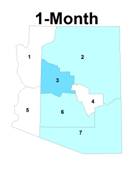

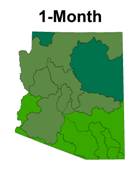
SHORT TERM CONDITIONS: 1-6 MONTHS
December was extremely
wet everywhere in the state; between the 75th and 84th percentile
in the southern watersheds; between the 89th and 95th
percentile in the central watersheds; and between the 89th and 100th
percentile in the northern watersheds.
Most of the precipitation fell in a five day period from the 6th
through the 11th, as part of a major winter storm that brought
significant snowfall to the mountains. The
series of cold fronts that passed through the state lowered temperatures
dramatically from the previous month.
November had been the 3rd warmest year since 1895, but
December temperatures were near average along the lower Colorado River and well
below average elsewhere, with
|
Watershed |
Precipitation Percentile |
Climate
Division |
Temperature Percentile |
|
Virgin |
100.00 |
CD1 |
45.13 |
|
|
89.19 |
CD2 |
36.28 |
|
Little |
97.30 |
CD3 |
24.78 |
|
Verde |
94.44 |
CD4 |
46.46 |
|
Bill
Williams |
89.19 |
CD5 |
44.25 |
|
|
89.19 |
CD6 |
26.99 |
|
|
89.19 |
CD7 |
30.97 |
|
Salt |
91.89 |
|
|
|
|
83.78 |
|
|
|
|
83.78 |
|
|
|
|
83.78 |
|
|
|
San Pedro |
77.14 |
|
|
|
Willcox
Playa |
75.68 |
|
|
|
San Simon |
83.78 |
|
|
|
White
Water Draw |
75.68 |
|
|
DECEMBER 2007: percentiles of precipitation for the 15
|
Watershed |
Precipitation Percentile |
Climate
Division |
Temperature Percentile |
|
Virgin |
50.00 |
CD1 |
82.30 |
|
|
40.54 |
CD2 |
80.53 |
|
Little |
54.05 |
CD3 |
74.78 |
|
Verde |
63.89 |
CD4 |
92.92 |
|
Bill
Williams |
54.05 |
CD5 |
79.20 |
|
|
70.27 |
CD6 |
89.38 |
|
|
75.68 |
CD7 |
81.42 |
|
Salt |
70.27 |
|
|
|
|
70.27 |
|
|
|
|
51.35 |
|
|
|
|
59.46 |
|
|
|
San Pedro |
54.29 |
|
|
|
Willcox
Playa |
52.78 |
|
|
|
San Simon |
72.97 |
|
|
|
White
Water Draw |
54.05 |
|
|
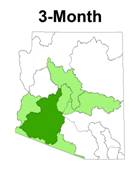
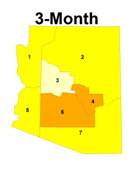
OCTOBER 2007 - DECEMBER 2007
(3-month): percentiles of precipitation for
the 15
|
Watershed |
Precipitation Percentile |
Climate
Division |
Temperature Percentile |
|
Virgin |
17.14 |
CD1 |
85.40 |
|
|
70.27 |
CD2 |
92.04 |
|
Little |
75.68 |
CD3 |
92.04 |
|
Verde |
77.78 |
CD4 |
93.81 |
|
Bill
Williams |
62.16 |
CD5 |
90.27 |
|
|
59.46 |
CD6 |
96.46 |
|
|
91.89 |
CD7 |
91.15 |
|
Salt |
75.68 |
|
|
|
|
70.27 |
|
|
|
|
56.76 |
|
|
|
|
54.05 |
|
|
|
San Pedro |
48.57 |
|
|
|
Willcox
Playa |
50.00 |
|
|
|
San Simon |
67.57 |
|
|
|
White
Water Draw |
52.78 |
|
|
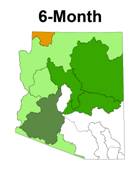
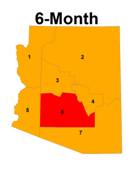
JULY 2007 – DECEMBER 2007 (6-month): percentiles of precipitation for the 15
INTERMEDIATE
TERM CONDITIONS: 12-24 MONTHS
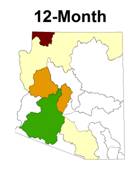
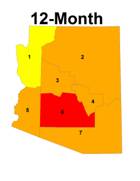
The 12-month period is
now about average for precipitation in most watersheds with the wet second half
of the calendar year balancing out the dry first half of the calendar
year. Notable exceptions are the very
dry Virgin, Bill Williams and
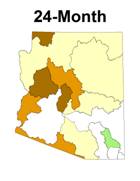
The 24 month period
is yet again the driest period, although now only 3 watersheds are below the 12th
percentile, and five are near or above average for precipitation. The dry watersheds are toward the north half
of the state, indicating that the 24-month deficit is due more to winter
dryness than summer dryness.
Temperatures are all above the 81st percentile with the
southern 1/3 of the state above the 98th percentile.
Watershed |
Precipitation Percentile |
Climate
Division |
Temperature Percentile |
|
Virgin |
2.86 |
CD1 |
83.04 |
|
|
37.84 |
CD2 |
94.64 |
|
Little |
48.65 |
CD3 |
91.96 |
|
Verde |
43.24 |
CD4 |
91.96 |
|
Bill
Williams |
18.92 |
CD5 |
92.86 |
|
|
24.32 |
CD6 |
96.43 |
|
|
75.68 |
CD7 |
94.64 |
|
Salt |
56.76 |
|
|
|
|
40.54 |
|
|
|
|
56.76 |
|
|
|
|
35.14 |
|
|
|
San Pedro |
40.54 |
|
|
|
Willcox
Playa |
54.05 |
|
|
|
San Simon |
45.95 |
|
|
|
White
Water Draw |
59.46 |
|
|
JANUARY 2007 – DECEMBER 2007
(12-month): percentiles of precipitation for
the 15
|
Watershed |
Precipitation Percentile |
Climate
Division |
Temperature Percentile |
|
Virgin |
11.76 |
CD1 |
81.98 |
|
|
27.78 |
CD2 |
93.69 |
|
Little |
36.11 |
CD3 |
90.99 |
|
Verde |
19.44 |
CD4 |
90.99 |
|
Bill
Williams |
8.33 |
CD5 |
92.79 |
|
|
11.11 |
CD6 |
98.20 |
|
|
44.44 |
CD7 |
99.10 |
|
Salt |
27.78 |
|
|
|
|
22.22 |
|
|
|
|
55.56 |
|
|
|
|
30.56 |
|
|
|
San Pedro |
47.22 |
|
|
|
Willcox
Playa |
66.67 |
|
|
|
San Simon |
16.67 |
|
|
|
White
Water Draw |
58.33 |
|
|
JANUARY 2006 – DECEMBER 2007
(24-month): percentiles of precipitation for
the 15
LONG TERM
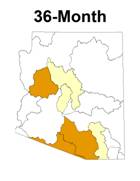
CONDITIONS: 36-48 MONTHS
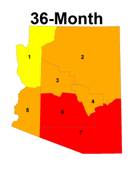
The 36-month period has
nine watersheds near normal for precipitation, and only three at or below the
20th percentile. The
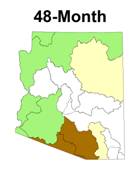
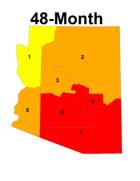
The 48-month period
again shows above average precipitation across the western part of the state,
and near average precipitation in eastern and southern
|
|
Precipitation Percentile |
Climate
Division |
Temperature Percentile |
|
Virgin |
51.52 |
CD1 |
79.09 |
|
|
45.71 |
CD2 |
92.73 |
|
Little |
45.71 |
CD3 |
91.82 |
|
Verde |
37.14 |
CD4 |
94.55 |
|
Bill
Williams |
17.14 |
CD5 |
89.09 |
|
|
31.43 |
CD6 |
98.18 |
|
|
54.29 |
CD7 |
100.00 |
|
Salt |
45.71 |
|
|
|
|
48.57 |
|
|
|
|
51.43 |
|
|
|
|
20.00 |
|
|
|
San Pedro |
34.29 |
|
|
|
Willcox
Playa |
48.57 |
|
|
|
San Simon |
17.14 |
|
|
|
White Water
Draw |
57.14 |
|
|
JANUARY 2005 – DECEMBER 2007
(36-month): percentiles of temperature, and
precipitation for the 15
|
Watershed |
Precipitation Percentile |
Climate
Division |
Temperature Percentile |
|
Virgin |
64.52 |
CD1 |
77.06 |
|
|
67.65 |
CD2 |
90.83 |
|
Little |
35.29 |
CD3 |
91.74 |
|
Verde |
55.88 |
CD4 |
96.33 |
|
Bill
Williams |
41.18 |
CD5 |
88.07 |
|
|
41.18 |
CD6 |
97.25 |
|
|
61.76 |
CD7 |
99.08 |
|
Salt |
50.00 |
|
|
|
|
67.65 |
|
|
|
|
44.12 |
|
|
|
|
8.82 |
|
|
|
San Pedro |
29.41 |
|
|
|
Willcox
Playa |
52.94 |
|
|
|
San Simon |
14.71 |
|
|
|
White
Water Draw |
55.88 |
|
|
JANUARY 2004 – DECEMBER 2007
(48-month): percentiles of temperature, and
precipitation for the 15
January 2008 Arizona Drought
Update based on precipitation data through December 2007)
The
following summary describes the heat and dryness across the state for the 1-,
3-, 6-, 12-, 24-, 36-, and 48-month periods.
SUMMARY
December
was extremely wet everywhere in the state; between the 75th and 84th
percentile in the southern watersheds; between the 89th and 95th
percentile in the central watersheds; and between the 89th and 100th
percentile in the northern watersheds.
Most of the precipitation fell in a five day period from the 6th
through the 11th, as part of a major winter storm that brought
significant snowfall to the mountains.
The series of cold fronts that passed through the state lowered
temperatures dramatically from the previous month. November had been the 3rd warmest
year since 1895, but December temperatures were near average along the lower
Colorado River and well below average elsewhere, with
The 3-month period
of October through December had nearly average precipitation in the northern
and southeastern watersheds, and well above average precipitation in the
central and southwestern watersheds. The
wet conditions are mostly a result of the very wet December across the
state. The cold December, averaged with
the very warm October and November, brought the three-month average
temperatures down near the 80th percentile in most climate
divisions. Even the hotter climate
divisions of Gila, Maricopa and
The 6-month period
precipitation was near average in the southeast, and well above average in all
other watersheds. This period reflects
both the wet monsoon and the wet early winter.
The wet December brought the
The 12-month period
is now about average for precipitation in most watersheds with the wet second
half of the calendar year balancing out the dry first half of the calendar
year. Notable exceptions are the very
dry Virgin, Bill Williams and
The 24 month period
is yet again the driest period, although now only 3 watersheds are below the 12th
percentile, and five are near or above average for precipitation. The dry watersheds are toward the north half
of the state, indicating that the 24-month deficit is due more to winter
dryness than summer dryness.
Temperatures are all above the 81st percentile with the
southern 1/3 of the state above the 98th percentile.
The 36-month period
has nine watersheds near normal for precipitation, and only three at or below
the 20th percentile. The
The 48-month period
again shows above average precipitation across the western part of the state,
and near average precipitation in eastern and southern