State Precipitation &
Temperature Update for
Conditions through January
2007
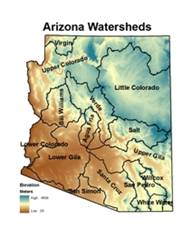
Precipitation
is monitored for the state of
Here, precipitation
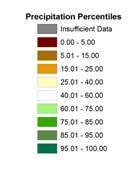
percentile values for the most recent month, along with previous 3-, 6-, 12-,
24-, 36-, and 48-month total are shown for each watershed. Low percentile values (brown shading)
indicate dry conditions while high values (green shading) indicate wet
conditions. For example, a precipitation total that falls at the 100th
percentile means that it is the highest precipitation total for the
1971-present period.
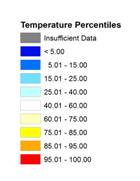
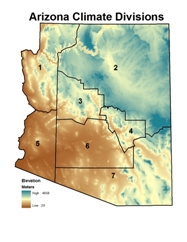 Temperature is monitored for the state of
Here, temperature
percentile values for the most recent month, along with previous 3-, 6-, 12-,
24-, 36-, and 48-month averages are shown for each climate division. Low percentile values (blue shading) indicate
cool conditions while high values (orange/red shading) indicate hot conditions.
For example, a temperature that falls at the 100th percentile means
that it is the highest average temperature for the 1895-present period.
The maps of the seven
periods for precipitation and temperature are shown below, with tables of the
percentile values and descriptive text following the maps. Current update is 2/26/2007. The data are preliminary, and there are some
missing precipitation data in the San Pedro watershed.
Precipitation Percentiles by Watershed
(through January 2007)
Temperature Percentiles by Climate
Division (through January 2007)
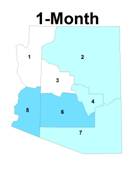
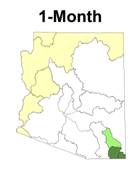
SHORT TERM CONDITIONS: 1-6 MONTHS
January precipitation
was below average in the northern and western watersheds and near average over
most of the state. The Willcox and White
Water Draw watersheds had above average precipitation as the January storm
tracks came across
|
Watershed |
Precipitation Percentile |
Climate
Division |
Temperature Percentile |
|
Virgin |
34.72 |
CD1 |
46.02 |
|
|
37.84 |
CD2 |
35.40 |
|
Little |
50.00 |
CD3 |
42.92 |
|
Verde |
43.24 |
CD4 |
28.76 |
|
Bill
Williams |
29.73 |
CD5 |
20.35 |
|
|
45.95 |
CD6 |
24.78 |
|
|
40.54 |
CD7 |
29.20 |
|
Salt |
51.35 |
|
|
|
|
35.14 |
|
|
|
|
56.76 |
|
|
|
|
40.54 |
|
|
|
San Pedro |
48.65 |
|
|
|
Willcox
Playa |
64.86 |
|
|
|
San Simon |
48.65 |
|
|
|
White
Water Draw |
86.11 |
|
|
JANUARY 2007: percentiles of precipitation for the 15
|
Watershed |
Precipitation Percentile |
Climate
Division |
Temperature Percentile |
|
Virgin |
23.53 |
CD1 |
65.49 |
|
|
16.67 |
CD2 |
70.35 |
|
Little |
17.14 |
CD3 |
68.58 |
|
Verde |
14.29 |
CD4 |
61.95 |
|
Bill
Williams |
8.33 |
CD5 |
44.25 |
|
|
16.67 |
CD6 |
55.31 |
|
|
11.11 |
CD7 |
64.60 |
|
Salt |
16.67 |
|
|
|
|
13.89 |
|
|
|
|
25.00 |
|
|
|
|
8.33 |
|
|
|
San Pedro |
32.35 |
|
|
|
Willcox
Playa |
40.00 |
|
|
|
San Simon |
13.89 |
|
|
|
White
Water Draw |
45.71 |
|
|
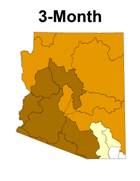
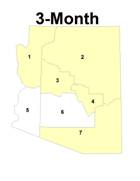
NOVEMBER 2006 - JANUARY 2007
(3-month): percentiles of precipitation for
the 15
|
Watershed |
Precipitation Percentile |
Climate
Division |
Temperature Percentile |
|
Virgin |
24.24 |
CD1 |
65.49 |
|
|
41.67 |
CD2 |
43.36 |
|
Little |
31.43 |
CD3 |
55.75 |
|
Verde |
31.43 |
CD4 |
40.27 |
|
Bill
Williams |
13.89 |
CD5 |
57.96 |
|
|
36.11 |
CD6 |
63.72 |
|
|
33.33 |
CD7 |
46.02 |
|
Salt |
33.33 |
|
|
|
|
41.67 |
|
|
|
|
44.44 |
|
|
|
|
33.33 |
|
|
|
San Pedro |
47.06 |
|
|
|
Willcox
Playa |
57.14 |
|
|
|
San Simon |
25.00 |
|
|
|
White
Water Draw |
62.86 |
|
|
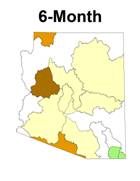
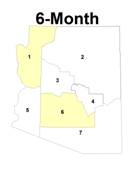
AUGUST 2006 – JANUARY 2007 (6-month): percentiles of precipitation for the 15
INTERMEDIATE
TERM CONDITIONS: 12-24 MONTHS
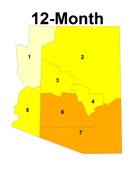
Precipitation for the
12-month period is still well below average across most of the state, except
for the southeast watersheds which benefited from an extremely wet monsoon, and
from the southern storm tracks in January.
The southeast and south central climate divisions are still the hottest,
but all divisions are below the 95th percentile.
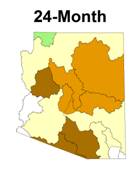
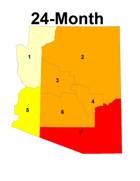
The two-year period
shows only the Lower Colorado,
Watershed |
Precipitation Percentile |
Climate
Division |
Temperature Percentile |
|
Virgin |
35.29 |
CD1 |
75.00 |
|
|
22.22 |
CD2 |
75.89 |
|
Little |
36.11 |
CD3 |
83.93 |
|
Verde |
22.22 |
CD4 |
78.57 |
|
Bill
Williams |
5.56 |
CD5 |
81.70 |
|
|
13.89 |
CD6 |
86.61 |
|
|
22.22 |
CD7 |
94.64 |
|
Salt |
27.78 |
|
|
|
|
19.44 |
|
|
|
|
50.00 |
|
|
|
|
41.67 |
|
|
|
San Pedro |
63.89 |
|
|
|
Willcox
Playa |
66.67 |
|
|
|
San Simon |
16.67 |
|
|
|
White
Water Draw |
60.00 |
|
|
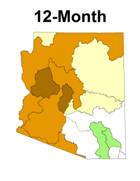
FEBRUARY 2006 – JANUARY 2007
(12-month): percentiles of precipitation for
the 15
|
Watershed |
Precipitation Percentile |
Climate
Division |
Temperature Percentile |
|
Virgin |
60.61 |
CD1 |
72.97 |
|
|
34.29 |
CD2 |
88.29 |
|
Little |
20.00 |
CD3 |
86.49 |
|
Verde |
20.00 |
CD4 |
89.19 |
|
Bill
Williams |
11.43 |
CD5 |
84.68 |
|
|
20.00 |
CD6 |
90.99 |
|
|
28.57 |
CD7 |
99.10 |
|
Salt |
20.00 |
|
|
|
|
54.29 |
|
|
|
|
28.57 |
|
|
|
|
11.43 |
|
|
|
San Pedro |
31.43 |
|
|
|
Willcox
Playa |
37.14 |
|
|
|
San Simon |
5.71 |
|
|
|
White
Water Draw |
42.86 |
|
|
FEBRUARY 2005 – JANUARY 2007
(24-month): percentiles of precipitation for
the 15
LONG TERM
CONDITIONS: 36-48 MONTHS
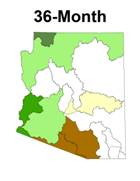
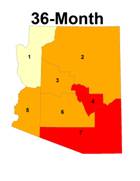
The 36-month
precipitation remains well above average in the northern and western
watersheds, below average in the south central watersheds and near average
elsewhere in the state. The
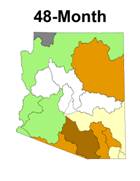
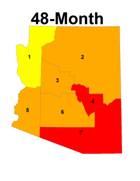
The dry El Niño has
produced very little change in the 48-month precipitation patterns. The state is still split with the eastern
half drier than average and the western half wetter than average. The central watersheds remain near
normal. Temperatures are above the 75th
percentile everywhere in the state, with the hot spots in
Watershed |
Precipitation Percentile |
Climate
Division |
Temperature Percentile |
|
Virgin |
93.75 |
CD1 |
74.55 |
|
|
70.59 |
CD2 |
90.91 |
|
Little |
44.12 |
CD3 |
86.36 |
|
Verde |
55.88 |
CD4 |
95.45 |
|
Bill
Williams |
50.00 |
CD5 |
87.27 |
|
|
50.00 |
CD6 |
90.91 |
|
|
61.76 |
CD7 |
98.18 |
|
Salt |
38.24 |
|
|
|
|
82.35 |
|
|
|
|
41.18 |
|
|
|
|
8.82 |
|
|
|
San Pedro |
41.18 |
|
|
|
Willcox
Playa |
47.06 |
|
|
|
San Simon |
11.76 |
|
|
|
White
Water Draw |
50.00 |
|
|
FEBRUARY 2004 – JANUARY 2007
(36-month): percentiles of temperature, and
precipitation for the 15
|
Watershed |
Precipitation Percentile |
Climate
Division |
Temperature Percentile |
|
Virgin |
-99.99 |
CD1 |
77.06 |
|
|
63.64 |
CD2 |
91.74 |
|
Little |
18.18 |
CD3 |
91.74 |
|
Verde |
54.55 |
CD4 |
96.33 |
|
Bill
Williams |
48.48 |
CD5 |
88.07 |
|
|
51.52 |
CD6 |
90.83 |
|
|
60.61 |
CD7 |
98.17 |
|
Salt |
42.42 |
|
|
|
|
74.24 |
|
|
|
|
27.27 |
|
|
|
|
12.12 |
|
|
|
San Pedro |
21.21 |
|
|
|
Willcox
Playa |
18.18 |
|
|
|
San Simon |
21.21 |
|
|
|
White
Water Draw |
36.36 |
|
|
FEBRUARY 2003 – JANUARY 2007
(48-month): percentiles of temperature, and
precipitation for the 15
February 2007
The
following summary describes the heat and dryness across the state for the 1-,
3-, 6-, 12-, 24-, 36-, and 48-month periods.
SUMMARY
January
- Precipitation was below average in the northern and western watersheds and
near average over most of the state. The
Willcox and White Water Draw watersheds had above average precipitation as the
January storm tracks came across
Three-month period
– November through January was much drier than average, below the 25th
percentile everywhere, except the southeast corner, where the southerly storm
tracks in January dropped precipitation on their way into New Mexico. Temperatures over the 3-month period were
slightly above average for most of the state, due in part to the extremely warm
November. The coolest temperatures were in Maricopa and Pinal counties, which
had very cold temperatures in both December and January.
Six-month period
– August through January, which represents a fairly dry fall and early winter season, is below average for
the most of the state, and near average for the southeast and Colorado River
watersheds. Only White Water Draw
remains well above average at the 62nd percentile. Temperatures were near or slightly above
average everywhere in the state for the past six months ranging from the 40th
to the 65th percentile.
Twelve-month period
– Precipitation for the 12-month period is still well below average across most
of the state, except for the southeast watersheds which benefited from an
extremely wet monsoon, and from the southern storm tracks in January. The southeast and south central climate
divisions are still the hottest, but all divisions are below the 95th
percentile.
Two-year period
- Only the Lower Colorado,
Three-year period
- Precipitation remains well above average in the northern and western
watersheds, below average in the south central watersheds and near average
elsewhere in the state. The
Four-year period
- The dry El Niño has produced very little change in the 48-month precipitation
patterns. The state is still split with
the eastern half drier than average and the western half wetter than average. The central watersheds remain near
normal. Temperatures are above the 75th
percentile everywhere in the state, with the hot spots in