State Precipitation &
Temperature Update for
Conditions through January 2009
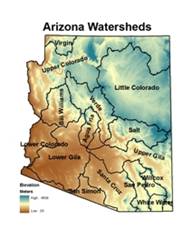
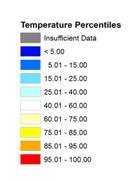
Precipitation
is monitored for the state of
Here, precipitation
percentile values for the most recent month, along with previous 3-, 6-, 12-,
24-, 36-, and 48-month total are shown for each watershed. Low percentile values (brown shading) indicate
dry conditions while high values (green shading) indicate wet conditions. For
example, a precipitation total that falls at the 100th percentile
means that it is the highest precipitation total for the 1971-present period.
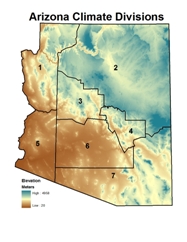 Temperature is monitored for the state of
Here, temperature
percentile values for the most recent month, along with previous 3-, 6-, 12-,
24-, 36-, and 48-month averages are shown for each climate division. Low percentile values (blue shading) indicate
cool conditions while high values (orange/red shading) indicate hot conditions.
For example, a temperature that falls at the 100th percentile means
that it is the highest average temperature for the 1895-present period.
The maps of the seven
periods for precipitation and temperature are shown below, with tables of the
percentile values and descriptive text following the maps. Current update is 03/16/2009. The data are preliminary.
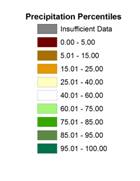
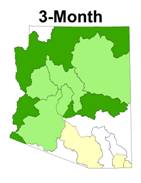
Precipitation Percentiles by Watershed
(through January 2009)
Temperature Percentiles by Climate
Division (through January 2009)
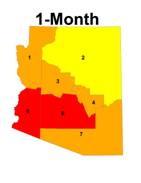
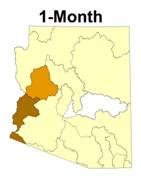
SHORT TERM CONDITIONS: 1-6 MONTHS
January was unusually
dry across the entire state, with the driest conditions in the Bill Williams
and lower
|
Watershed |
Precipitation Percentile |
Climate
Division |
Temperature Percentile |
|
Virgin |
39.47 |
CD1 |
92.17 |
|
|
33.33 |
CD2 |
84.35 |
|
Little |
39.47 |
CD3 |
92.17 |
|
Verde |
28.21 |
CD4 |
92.17 |
|
Bill
Williams |
23.08 |
CD5 |
95.65 |
|
|
28.21 |
CD6 |
95.65 |
|
|
33.33 |
CD7 |
93.91 |
|
Salt |
43.59 |
|
|
|
|
12.82 |
|
|
|
|
38.46 |
|
|
|
|
38.46 |
|
|
|
San Pedro |
35.90 |
|
|
|
Willcox
Playa |
38.46 |
|
|
|
San Simon |
38.46 |
|
|
|
White
Water Draw |
36.84 |
|
|
JANUARY 2009: percentiles of precipitation for the 15
|
Watershed |
Precipitation Percentile |
Climate
Division |
Temperature Percentile |
|
Virgin |
55.56 |
CD1 |
81.74 |
|
|
76.32 |
CD2 |
85.22 |
|
Little |
70.27 |
CD3 |
83.48 |
|
Verde |
70.27 |
CD4 |
69.13 |
|
Bill
Williams |
65.79 |
CD5 |
93.04 |
|
|
71.05 |
CD6 |
91.30 |
|
|
71.05 |
CD7 |
84.35 |
|
Salt |
78.95 |
|
|
|
|
78.95 |
|
|
|
|
50.00 |
|
|
|
|
36.84 |
|
|
|
San Pedro |
47.22 |
|
|
|
Willcox
Playa |
40.54 |
|
|
|
San Simon |
52.63 |
|
|
|
White
Water Draw |
35.14 |
|
|
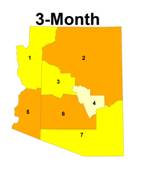
NOVEMBER 2008 - JANUARY 2009
(3-month): percentiles of precipitation for
the 15
|
Watershed |
Precipitation Percentile |
Climate
Division |
Temperature Percentile |
|
Virgin |
14.29 |
CD1 |
81.74 |
|
|
57.89 |
CD2 |
81.74 |
|
Little |
29.73 |
CD3 |
85.22 |
|
Verde |
48.65 |
CD4 |
51.30 |
|
Bill
Williams |
52.63 |
CD5 |
97.39 |
|
|
42.11 |
CD6 |
98.26 |
|
|
60.53 |
CD7 |
72.17 |
|
Salt |
71.05 |
|
|
|
|
55.26 |
|
|
|
|
42.11 |
|
|
|
|
34.21 |
|
|
|
San Pedro |
36.11 |
|
|
|
Willcox
Playa |
18.92 |
|
|
|
San Simon |
60.53 |
|
|
|
White
Water Draw |
29.73 |
|
|
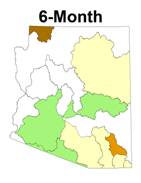
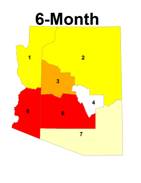
AUGUST 2008 – JANUARY 2009 (6-month): percentiles of precipitation for the 15
INTERMEDIATE
TERM CONDITIONS: 12-24 MONTHS
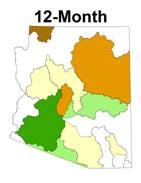
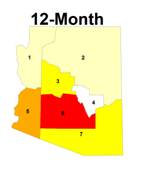
The 12-month period precipitation
was very mixed across the state, just like the six month period. Northern Arizona was generally drier than
average, while southern
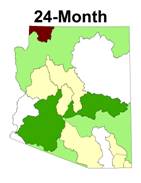
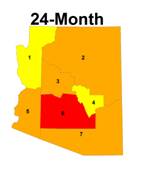
The 24 month period is
the wettest long-term period, but is inconsistent from watershed to
watershed. Seven watersheds in central
and southern Arizona had slightly below average precipitation over the last two
years, while five watersheds in north, east central and southwest Arizona were
wetter than average. Three watersheds
had near average precipitation.
Temperatures in the past two years have been well above average in all
areas of the state, with the warmest temperatures in Maricopa and Pinal
counties.
Watershed |
Precipitation Percentile |
Climate
Division |
Temperature Percentile |
|
Virgin |
5.56 |
CD1 |
73.68 |
|
|
57.89 |
CD2 |
71.93 |
|
Little |
23.68 |
CD3 |
82.46 |
|
Verde |
26.32 |
CD4 |
43.86 |
|
Bill
Williams |
31.58 |
CD5 |
94.74 |
|
|
23.68 |
CD6 |
98.25 |
|
|
76.32 |
CD7 |
83.77 |
|
Salt |
71.05 |
|
|
|
|
52.63 |
|
|
|
|
55.26 |
|
|
|
|
36.84 |
|
|
|
San Pedro |
55.26 |
|
|
|
Willcox
Playa |
34.21 |
|
|
|
San Simon |
60.53 |
|
|
|
White
Water Draw |
40.54 |
|
|
FEBRUARY 2008 – JANUARY 2009
(12-month): percentiles of precipitation for
the 15
|
Watershed |
Precipitation Percentile |
Climate
Division |
Temperature Percentile |
|
Virgin |
2.86 |
CD1 |
76.99 |
|
|
72.97 |
CD2 |
90.27 |
|
Little |
48.65 |
CD3 |
88.50 |
|
Verde |
37.84 |
CD4 |
82.30 |
|
Bill
Williams |
29.73 |
CD5 |
92.92 |
|
|
32.43 |
CD6 |
98.23 |
|
|
81.08 |
CD7 |
94.69 |
|
Salt |
81.08 |
|
|
|
|
51.35 |
|
|
|
|
62.16 |
|
|
|
|
32.43 |
|
|
|
San Pedro |
43.24 |
|
|
|
Willcox
Playa |
37.84 |
|
|
|
San Simon |
62.16 |
|
|
|
White
Water Draw |
35.14 |
|
|
FEBRUARY 2007 – JANUARY 2009
(24-month): percentiles of precipitation for
the 15
LONG TERM
CONDITIONS: 36-48 MONTHS
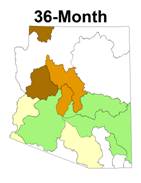
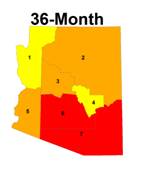
The 36-month period shows
the upper and Little Colorado River watersheds had near average precipitation,
while the Bill Williams, Verde and Agua Fria watersheds, also in northern
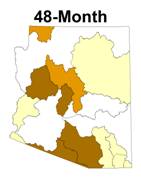
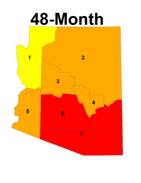
The 48-month period became
the driest period last month, and it continues to be the driest period as the
winter of 2008-2009 replaces the winter of 2004-2005. Six watersheds are below the 25th
percentile, five watersheds are between the 25th and 40th
percentile, and four watersheds are above the 40th percentile. The four-year temperatures continue to be extremely
high, with the southern third of the state above the 99th
percentile, and the coolest climate division,
|
|
Precipitation Percentile |
Climate
Division |
Temperature Percentile |
|
Virgin |
5.88 |
CD1 |
76.79 |
|
|
44.44 |
CD2 |
88.39 |
|
Little |
52.78 |
CD3 |
88.39 |
|
Verde |
25.00 |
CD4 |
84.82 |
|
Bill
Williams |
11.11 |
CD5 |
91.96 |
|
|
16.67 |
CD6 |
97.32 |
|
|
69.44 |
CD7 |
98.21 |
|
Salt |
63.89 |
|
|
|
|
33.33 |
|
|
|
|
63.89 |
|
|
|
|
27.78 |
|
|
|
San Pedro |
58.33 |
|
|
|
Willcox
Playa |
61.11 |
|
|
|
San Simon |
44.44 |
|
|
|
White
Water Draw |
50.00 |
|
|
FEBRUARY 2006 – JANUARY 2009
(36-month): percentiles of temperature, and
precipitation for the 15
|
Watershed |
Precipitation Percentile |
Climate
Division |
Temperature Percentile |
|
Virgin |
25.00 |
CD1 |
75.68 |
|
|
48.57 |
CD2 |
90.09 |
|
Little |
31.43 |
CD3 |
87.39 |
|
Verde |
20.00 |
CD4 |
90.99 |
|
Bill
Williams |
8.57 |
CD5 |
90.09 |
|
|
8.57 |
CD6 |
99.10 |
|
|
60.00 |
CD7 |
100.00 |
|
Salt |
54.29 |
|
|
|
|
40.00 |
|
|
|
|
42.86 |
|
|
|
|
11.43 |
|
|
|
San Pedro |
31.43 |
|
|
|
Willcox
Playa |
31.43 |
|
|
|
San Simon |
14.29 |
|
|
|
White
Water Draw |
37.14 |
|
|
FEBRUARY 2005 – JANUARY 2009
(48-month): percentiles of temperature, and
precipitation for the 15
February 2008 Arizona
Drought Update based on precipitation data through January 2008)
The
following summary describes the heat and dryness across the state for the 1-,
3-, 6-, 12-, 24-, 36-, and 48-month periods.
SUMMARY
January
was unusually dry across the entire state, with the driest conditions in the
Bill Williams and lower
The 3-month period
of December through January was much wetter than average for all but the
southeastern third of the state. The two
driest watersheds,
The 6-month period
precipitation is much less homogeneously distributed. The northern watersheds, had near average
precipitation, although the Virgin River watershed was very dry at the 14th
percentile, and the
The 12-month period
precipitation was very mixed across the state, just like the six month period. Northern Arizona was generally drier than
average, while southern
The 24 month period
is the wettest long-term period, but is inconsistent from watershed to
watershed. Seven watersheds in central
and southern Arizona had slightly below average precipitation over the last two
years, while five watersheds in north, east central and southwest Arizona were
wetter than average. Three watersheds
had near average precipitation.
Temperatures in the past two years have been well above average in all
areas of the state, with the warmest temperatures in Maricopa and Pinal
counties.
The 36-month period
shows the upper and Little Colorado River watersheds had near average
precipitation, while the Bill Williams, Verde and Agua Fria watersheds, also in
northern
The 48-month period
became the driest period last month, and it continues to be the driest period
as the winter of 2008-2009 replaces the winter of 2004-2005. Six watersheds are below the 25th
percentile, five watersheds are between the 25th and 40th
percentile, and four watersheds are above the 40th percentile. The four-year temperatures continue to be
extremely high, with the southern third of the state above the 99th
percentile, and the coolest climate division,