State Precipitation &
Temperature Update for
Conditions through February
2007
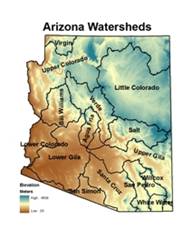
Precipitation
is monitored for the state of
Here, precipitation
percentile values for the most recent month, along with previous 3-, 6-, 12-,
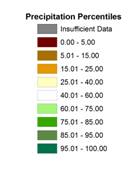
24-, 36-, and 48-month total are shown for each watershed. Low percentile values (brown shading) indicate
dry conditions while high values (green shading) indicate wet conditions. For
example, a precipitation total that falls at the 100th percentile
means that it is the highest precipitation total for the 1971-present period.
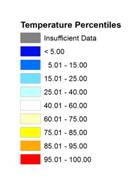
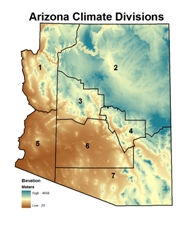 Temperature is monitored for the state of
Here, temperature
percentile values for the most recent month, along with previous 3-, 6-, 12-,
24-, 36-, and 48-month averages are shown for each climate division. Low percentile values (blue shading) indicate
cool conditions while high values (orange/red shading) indicate hot conditions.
For example, a temperature that falls at the 100th percentile means
that it is the highest average temperature for the 1895-present period.
The maps of the seven
periods for precipitation and temperature are shown below, with tables of the
percentile values and descriptive text following the maps. Current update is 3/30/2007. The data are preliminary.
Precipitation Percentiles by Watershed (through
February 2007)
Temperature Percentiles by Climate
Division (through February 2007)
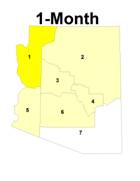
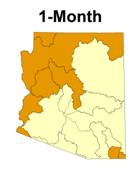
SHORT TERM CONDITIONS: 1-6 MONTHS
February precipitation
was below average everywhere in the state, and below the 25th
percentile in the northern and western watersheds. In contrast to January, the storm tracks
across the southern part of the state dropped little precipitation in
|
Watershed |
Precipitation Percentile |
Climate
Division |
Temperature Percentile |
|
Virgin |
21.62 |
CD1 |
84.51 |
|
|
24.32 |
CD2 |
69.47 |
|
Little |
35.14 |
CD3 |
61.06 |
|
Verde |
24.32 |
CD4 |
71.24 |
|
Bill
Williams |
22.97 |
CD5 |
62.83 |
|
|
32.43 |
CD6 |
74.34 |
|
|
29.73 |
CD7 |
55.31 |
|
Salt |
37.84 |
|
|
|
|
24.32 |
|
|
|
|
35.14 |
|
|
|
|
29.73 |
|
|
|
San Pedro |
27.03 |
|
|
|
Willcox
Playa |
27.78 |
|
|
|
San Simon |
29.73 |
|
|
|
White
Water Draw |
24.32 |
|
|
FEBRUARY 2007: percentiles of precipitation for the 15
|
Watershed |
Precipitation Percentile |
Climate
Division |
Temperature Percentile |
|
Virgin |
40.00 |
CD1 |
61.06 |
|
|
19.44 |
CD2 |
49.56 |
|
Little |
31.43 |
CD3 |
46.02 |
|
Verde |
25.71 |
CD4 |
51.33 |
|
Bill
Williams |
8.33 |
CD5 |
40.27 |
|
|
30.56 |
CD6 |
46.02 |
|
|
22.22 |
CD7 |
21.24 |
|
Salt |
36.11 |
|
|
|
|
13.89 |
|
|
|
|
44.44 |
|
|
|
|
19.44 |
|
|
|
San Pedro |
38.24 |
|
|
|
Willcox
Playa |
42.86 |
|
|
|
San Simon |
16.67 |
|
|
|
White
Water Draw |
51.43 |
|
|
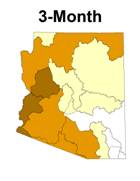
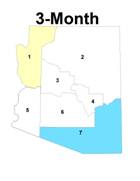
DECEMBER 2006 - FEBRUARY 2007
(3-month): percentiles of precipitation for
the 15
|
Watershed |
Precipitation Percentile |
Climate
Division |
Temperature Percentile |
|
Virgin |
33.33 |
CD1 |
69.03 |
|
|
36.11 |
CD2 |
39.38 |
|
Little |
28.57 |
CD3 |
52.21 |
|
Verde |
22.86 |
CD4 |
45.58 |
|
Bill
Williams |
19.44 |
CD5 |
60.62 |
|
|
19.44 |
CD6 |
62.83 |
|
|
27.78 |
CD7 |
66.37 |
|
Salt |
27.78 |
|
|
|
|
41.67 |
|
|
|
|
27.78 |
|
|
|
|
16.67 |
|
|
|
San Pedro |
44.12 |
|
|
|
Willcox
Playa |
40.00 |
|
|
|
San Simon |
16.67 |
|
|
|
White
Water Draw |
48.57 |
|
|
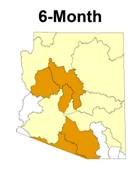
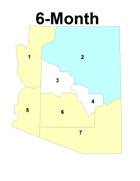
SEPTEMBER 2006 – FEBRUARY 2007
(6-month): percentiles of precipitation for
the 15
INTERMEDIATE
TERM CONDITIONS: 12-24 MONTHS
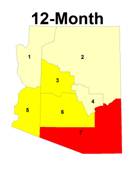
The western half of
the state experienced very dry conditions for the previous 12-month period,
while the eastern half of the state had near to slightly above average
precipitation. Due to a combination of
an extremely wet monsoon and some southerly winter storm tracks, precipitation
in the San Pedro watershed was almost at the 70th percentile. Temperatures for the previous 12 months remain
well above average, with the southeast climate division above the 96th
percentile.
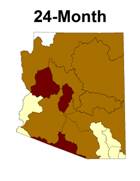
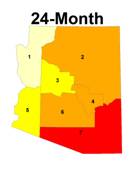
The two-year period paints
the bleakest picture of the drought status.
With the exception of the
Watershed |
Precipitation Percentile |
Climate
Division |
Temperature Percentile |
|
Virgin |
38.24 |
CD1 |
74.11 |
|
|
33.33 |
CD2 |
71.43 |
|
Little |
52.78 |
CD3 |
80.80 |
|
Verde |
36.11 |
CD4 |
71.88 |
|
Bill
Williams |
11.11 |
CD5 |
84.82 |
|
|
22.22 |
CD6 |
83.48 |
|
|
25.00 |
CD7 |
96.43 |
|
Salt |
52.78 |
|
|
|
|
33.33 |
|
|
|
|
55.56 |
|
|
|
|
47.22 |
|
|
|
San Pedro |
69.44 |
|
|
|
Willcox
Playa |
60.00 |
|
|
|
San Simon |
25.00 |
|
|
|
White
Water Draw |
54.29 |
|
|
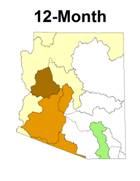
MARCH 2006 – FEBRUARY 2007
(12-month): percentiles of precipitation for
the 15
|
Watershed |
Precipitation Percentile |
Climate
Division |
Temperature Percentile |
|
Virgin |
48.48 |
CD1 |
72.97 |
|
|
11.43 |
CD2 |
85.59 |
|
Little |
11.43 |
CD3 |
84.68 |
|
Verde |
5.71 |
CD4 |
87.39 |
|
Bill
Williams |
2.86 |
CD5 |
84.68 |
|
|
2.86 |
CD6 |
92.79 |
|
|
5.71 |
CD7 |
99.10 |
|
Salt |
5.71 |
|
|
|
|
28.57 |
|
|
|
|
8.57 |
|
|
|
|
5.71 |
|
|
|
San Pedro |
25.71 |
|
|
|
Willcox
Playa |
31.43 |
|
|
|
San Simon |
2.86 |
|
|
|
White
Water Draw |
25.71 |
|
|
MARCH 2005 – FEBRUARY 2007
(24-month): percentiles of precipitation for
the 15
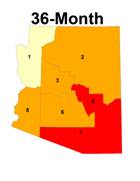
LONG TERM
CONDITIONS: 36-48 MONTHS
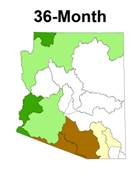
The 36-month precipitation,
which includes the wet winter of 2004-2005, remains only slightly above average
for most of the state. The Virgin, upper
and lower
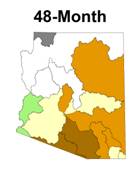
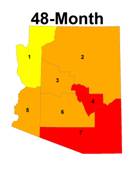
The 48-month
precipitation pattern is quite representative of the drought conditions across
the state, with one watershed above average, three watersheds near average and
10 watersheds below the 40th percentile for precipitation. The driest conditions are in the eastern and
southern parts of the state. The
long-term temperature pattern still has all areas above the 75th percentile,
with the hottest temperatures in
Watershed |
Precipitation Percentile |
Climate
Division |
Temperature Percentile |
|
Virgin |
78.12 |
CD1 |
74.55 |
|
|
67.65 |
CD2 |
89.09 |
|
Little |
44.12 |
CD3 |
86.82 |
|
Verde |
55.88 |
CD4 |
95.45 |
|
Bill
Williams |
52.94 |
CD5 |
87.27 |
|
|
44.12 |
CD6 |
90.00 |
|
|
61.76 |
CD7 |
99.09 |
|
Salt |
44.12 |
|
|
|
|
79.41 |
|
|
|
|
44.12 |
|
|
|
|
5.88 |
|
|
|
San Pedro |
26.47 |
|
|
|
Willcox
Playa |
38.24 |
|
|
|
San Simon |
8.82 |
|
|
|
White
Water Draw |
50.00 |
|
|
MARCH 2004 – FEBRUARY 2007
(36-month): percentiles of temperature, and
precipitation for the 15
|
Watershed |
Precipitation Percentile |
Climate
Division |
Temperature Percentile |
|
Virgin |
-99.99 |
CD1 |
77.06 |
|
|
54.55 |
CD2 |
89.91 |
|
Little |
15.15 |
CD3 |
92.66 |
|
Verde |
48.48 |
CD4 |
96.33 |
|
Bill
Williams |
42.42 |
CD5 |
89.91 |
|
|
24.24 |
CD6 |
89.91 |
|
|
39.39 |
CD7 |
99.08 |
|
Salt |
27.27 |
|
|
|
|
69.70 |
|
|
|
|
18.18 |
|
|
|
|
6.06 |
|
|
|
San Pedro |
15.15 |
|
|
|
Willcox
Playa |
18.18 |
|
|
|
San Simon |
12.12 |
|
|
|
White
Water Draw |
30.30 |
|
|
MARCH 2003 – FEBRUARY 2007
(48-month): percentiles of temperature, and
precipitation for the 15
March 2007
The
following summary describes the heat and dryness across the state for the 1-,
3-, 6-, 12-, 24-, 36-, and 48-month periods.
SUMMARY
February
- Precipitation was below average everywhere in the state, and below the 25th
percentile in the northern and western watersheds. In contrast to January, the storm tracks
across the southern part of the state dropped little precipitation in
Three-month period
– The 3-month period of December through February was below the 25th
percentile for the southwest deserts and the upper
Six-month period
– Precipitation for the fall and winter, represented by the 6-month period of
September through February, was very dry, below the 40th percentile,
throughout the state. Particularly hard
hit were the Verde, Bill Williams, Agua Fria,
Twelve-month period
– The western half of the state experienced very dry conditions for the
previous 12-month period, while the eastern half of the state had near to
slightly above average precipitation.
Due to a combination of an extremely wet monsoon and some southerly
winter storm tracks, precipitation in the San Pedro watershed was almost at the
70th percentile. Temperatures
for the previous 12 months remain well above average, with the southeast
climate division above the 96th percentile.
Two-year period
- The two-year period paints the bleakest picture of the drought status. With the exception of the
Three-year period
- The 36-month precipitation, which includes the wet winter of 2004-2005,
remains only slightly above average for most of the state. The Virgin, upper and lower
Four-year period
- The 48-month precipitation pattern is quite representative of the drought
conditions across the state, with one watershed above average, three watersheds
near average and 10 watersheds below the 40th percentile for precipitation. The driest conditions are in the eastern and
southern parts of the state. The
long-term temperature pattern still has all areas above the 75th
percentile, with the hottest temperatures in