State Precipitation &
Temperature Update for
Conditions through February 2008
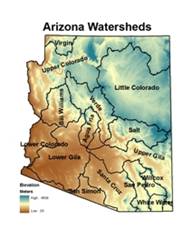
Precipitation
is monitored for the state of
Here, precipitation
percentile values for the most recent month, along with previous 3-, 6-, 12-,
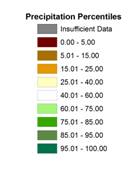
24-, 36-, and 48-month total are shown for each watershed. Low percentile values (brown shading) indicate
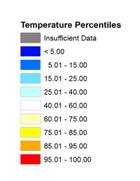
dry conditions while high values (green shading) indicate wet conditions. For
example, a precipitation total that falls at the 100th percentile
means that it is the highest precipitation total for the 1971-present period.
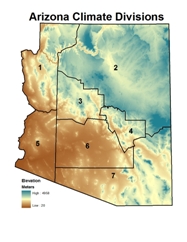 Temperature is monitored for the state of
Here, temperature
percentile values for the most recent month, along with previous 3-, 6-, 12-,
24-, 36-, and 48-month averages are shown for each climate division. Low percentile values (blue shading) indicate
cool conditions while high values (orange/red shading) indicate hot conditions.
For example, a temperature that falls at the 100th percentile means
that it is the highest average temperature for the 1895-present period.
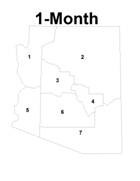
The maps of the seven
periods for precipitation and temperature are shown below, with tables of the
percentile values and descriptive text following the maps. Current update is 03/26/2008. The Upper Colorado and
Precipitation Percentiles by Watershed
(through February 2008)
Temperature Percentiles by Climate
Division (through February 2008)
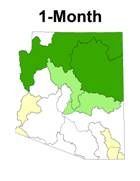
SHORT TERM CONDITIONS: 1-6 MONTHS
February precipitation
was near average for the southern half of the state, with slightly below-average
precipitation in the southeast (Whitewater Draw and Willcox) and southwest
(lower
|
Watershed |
Precipitation Percentile |
Climate
Division |
Temperature Percentile |
|
Virgin |
57.89 |
CD1 |
46.49 |
|
|
81.58 |
CD2 |
51.75 |
|
Little |
78.95 |
CD3 |
45.61 |
|
Verde |
65.79 |
CD4 |
50.44 |
|
Bill
Williams |
50.00 |
CD5 |
54.82 |
|
|
57.89 |
CD6 |
55.26 |
|
|
42.11 |
CD7 |
57.89 |
|
Salt |
60.53 |
|
|
|
|
39.47 |
|
|
|
|
42.11 |
|
|
|
|
52.63 |
|
|
|
San Pedro |
42.11 |
|
|
|
Willcox
Playa |
29.73 |
|
|
|
San Simon |
47.37 |
|
|
|
White
Water Draw |
31.58 |
|
|
FEBRUARY 2008: percentiles of precipitation for the 15
|
Watershed |
Precipitation Percentile |
Climate
Division |
Temperature Percentile |
|
Virgin |
83.33 |
CD1 |
41.67 |
|
|
91.89 |
CD2 |
29.82 |
|
Little |
94.44 |
CD3 |
29.39 |
|
Verde |
91.67 |
CD4 |
51.75 |
|
Bill
Williams |
81.08 |
CD5 |
41.23 |
|
|
81.08 |
CD6 |
32.46 |
|
|
81.08 |
CD7 |
39.47 |
|
Salt |
89.19 |
|
|
|
|
72.97 |
|
|
|
|
72.97 |
|
|
|
|
72.97 |
|
|
|
San Pedro |
62.86 |
|
|
|
Willcox
Playa |
63.89 |
|
|
|
San Simon |
81.08 |
|
|
|
White
Water Draw |
61.11 |
|
|
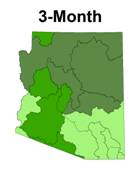
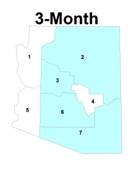
DECEMBER 2008 - FEBRUARY 2008
(3-month): percentiles of precipitation for
the 15
|
Watershed |
Precipitation Percentile |
Climate
Division |
Temperature Percentile |
|
Virgin |
44.12 |
CD1 |
66.67 |
|
|
83.78 |
CD2 |
63.16 |
|
Little |
63.89 |
CD3 |
63.16 |
|
Verde |
69.44 |
CD4 |
86.84 |
|
Bill
Williams |
56.76 |
CD5 |
70.18 |
|
|
56.76 |
CD6 |
83.33 |
|
|
67.57 |
CD7 |
87.72 |
|
Salt |
81.08 |
|
|
|
|
45.95 |
|
|
|
|
56.76 |
|
|
|
|
54.05 |
|
|
|
San Pedro |
45.71 |
|
|
|
Willcox
Playa |
36.11 |
|
|
|
San Simon |
72.97 |
|
|
|
White
Water Draw |
33.33 |
|
|
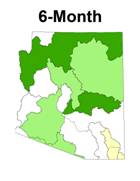
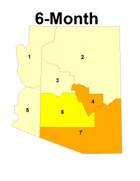
SEPTEMBER 2008 – FEBRUARY 2008
(6-month): percentiles of precipitation for
the 15
INTERMEDIATE
TERM CONDITIONS: 12-24 MONTHS
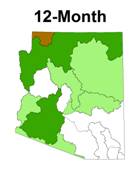
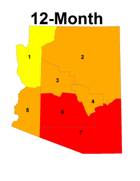
The 12-month period has
again improved across all watersheds except the
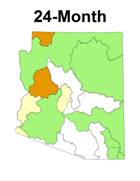
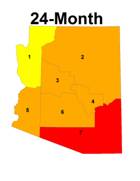
The 24-month period has
seven watersheds below average, five watersheds near average, and three
watersheds above average for precipitation.
The drier watersheds are in the west and south central region, while the
wetter than average watersheds are in the southeast. This is the opposite of the shorter-term
precipitation conditions, which have the southeast as the driest region. The 24-month period picks up the past two
monsoons which were very wet in the southeast.
Temperatures for the 24-month period continue to be above the 86th
percentile everywhere but the northwest, where they dropped just below the 79th
percentile.
Watershed |
Precipitation Percentile |
Climate
Division |
Temperature Percentile |
|
Virgin |
8.57 |
CD1 |
80.53 |
|
|
81.08 |
CD2 |
92.04 |
|
Little |
70.27 |
CD3 |
92.04 |
|
Verde |
62.16 |
CD4 |
93.81 |
|
Bill
Williams |
51.35 |
CD5 |
92.92 |
|
|
51.35 |
CD6 |
97.35 |
|
|
83.78 |
CD7 |
98.23 |
|
Salt |
70.27 |
|
|
|
|
62.16 |
|
|
|
|
59.46 |
|
|
|
|
48.65 |
|
|
|
San Pedro |
43.24 |
|
|
|
Willcox
Playa |
41.67 |
|
|
|
San Simon |
67.57 |
|
|
|
White
Water Draw |
44.44 |
|
|
MARCH 2008 – FEBRUARY 2008
(12-month): percentiles of precipitation for
the 15
|
Watershed |
Precipitation Percentile |
Climate
Division |
Temperature Percentile |
|
Virgin |
20.59 |
CD1 |
78.57 |
|
|
61.11 |
CD2 |
86.61 |
|
Little |
63.89 |
CD3 |
88.39 |
|
Verde |
47.22 |
CD4 |
86.61 |
|
Bill
Williams |
16.67 |
CD5 |
90.18 |
|
|
31.94 |
CD6 |
93.75 |
|
|
66.67 |
CD7 |
97.32 |
|
Salt |
58.33 |
|
|
|
|
36.11 |
|
|
|
|
63.89 |
|
|
|
|
41.67 |
|
|
|
San Pedro |
50.00 |
|
|
|
Willcox
Playa |
61.11 |
|
|
|
San Simon |
41.67 |
|
|
|
White
Water Draw |
63.89 |
|
|
MARCH 2007 – FEBRUARY 2008
(24-month): percentiles of precipitation for
the 15
LONG TERM
CONDITIONS: 36-48 MONTHS
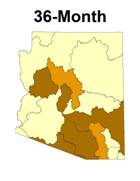
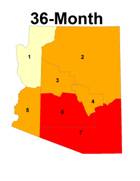
The 36-month period is
again the driest period with all watersheds below the 38th
percentile. Five watersheds are below the
15th percentile and eight are between the 25th and 38th
percentiles. Bill Williams and Agua Fria in west central
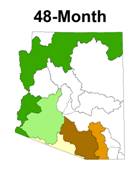
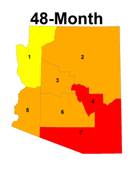
The 48-month period is
still split with above-average precipitation in the western watersheds,
below-average precipitation in the southeastern watersheds, and near- average
precipitation in the central and eastern watersheds.
|
|
Precipitation Percentile |
Climate
Division |
Temperature Percentile |
|
Virgin |
27.27 |
CD1 |
74.77 |
|
|
34.29 |
CD2 |
87.84 |
|
Little |
37.14 |
CD3 |
90.99 |
|
Verde |
17.14 |
CD4 |
94.59 |
|
Bill
Williams |
5.71 |
CD5 |
87.39 |
|
|
5.71 |
CD6 |
95.50 |
|
|
31.43 |
CD7 |
99.10 |
|
Salt |
25.71 |
|
|
|
|
34.29 |
|
|
|
|
14.29 |
|
|
|
|
11.43 |
|
|
|
San Pedro |
20.00 |
|
|
|
Willcox
Playa |
31.43 |
|
|
|
San Simon |
5.71 |
|
|
|
White
Water Draw |
34.29 |
|
|
MARCH 2006 – FEBRUARY 2008
(36-month): percentiles of temperature, and
precipitation for the 15
|
Watershed |
Precipitation Percentile |
Climate
Division |
Temperature Percentile |
|
Virgin |
58.06 |
CD1 |
76.36 |
|
|
76.47 |
CD2 |
90.00 |
|
Little |
44.12 |
CD3 |
92.73 |
|
Verde |
58.82 |
CD4 |
95.45 |
|
Bill
Williams |
50.00 |
CD5 |
90.00 |
|
|
52.94 |
CD6 |
94.55 |
|
|
64.71 |
CD7 |
100.00 |
|
Salt |
55.88 |
|
|
|
|
79.41 |
|
|
|
|
44.12 |
|
|
|
|
11.76 |
|
|
|
San Pedro |
23.53 |
|
|
|
Willcox
Playa |
44.12 |
|
|
|
San Simon |
29.41 |
|
|
|
White
Water Draw |
50.00 |
|
|
MARCH 2005 – FEBRUARY 2008 (48-month): percentiles of temperature, and precipitation for the 15
March 2008 Arizona Drought
Update based on precipitation data through February 2008)
The
following summary describes the heat and dryness across the state for the 1-,
3-, 6-, 12-, 24-, 36-, and 48-month periods.
SUMMARY
February
precipitation was near average for the southern half of the state, with
slightly below-average precipitation in the southeast (Whitewater Draw and
Willcox) and southwest (lower
The 3-month winter
period of December through February has been very wet across most of the state,
averaging between the 81st and 95th percentile. Cold, winter storms have moved through the
state from the southwest to the northeast, throughout the winter. The driest watersheds are in the southeast,
but they are between the 61st and 73rd percentile for
precipitation, certainly wetter than average.
The relatively cold weather in January and seasonal temperatures of February
dropped the 3-month temperatures to near or below average.
The 6-month period
precipitation, from September through February, continues to remain near- or
slightly below-average in the southeast, with Willcox and Whitewater Draw
around the 35th percentile.
The colder than average winter temperatures in the north have brought
the three northern climate divisions below the 67th percentile,
while the southeast remains above the 85th percentile for
temperature.
The 12-month period
has again improved across all watersheds except the
The 24-month period
has seven watersheds below average, five watersheds near average, and three
watersheds above average for precipitation.
The drier watersheds are in the west and south central region, while the
wetter than average watersheds are in the southeast. This is the opposite of the shorter-term
precipitation conditions, which have the southeast as the driest region. The 24-month period picks up the past two
monsoons which were very wet in the southeast.
Temperatures for the 24-month period continue to be above the 86th
percentile everywhere but the northwest, where they dropped just below the 79th
percentile.
The 36-month period
is again the driest period with all watersheds below the 38th
percentile. Five watersheds are below
the 15th percentile and eight are between the 25th and 38th
percentiles. Bill Williams and Agua Fria in west central
The 48-month period is
still split with above-average precipitation in the western watersheds,
below-average precipitation in the southeastern watersheds, and near- average
precipitation in the central and eastern watersheds.