State Precipitation &
Temperature Update for
Conditions through February 2009
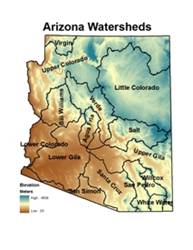
Precipitation
is monitored for the state of
Here, precipitation
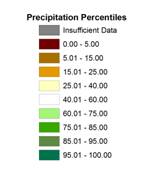
percentile values for the most recent month, along with previous 3-, 6-, 12-,
24-, 36-, and 48-month total are shown for each watershed. Low percentile values (brown shading) indicate
dry conditions while high values (green shading) indicate wet conditions. For
example, a precipitation total that falls at the 100th percentile
means that it is the highest precipitation total for the 1971-present period.
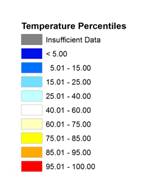
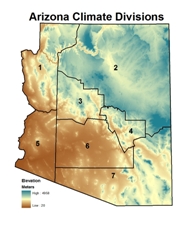 Temperature is monitored for the state of
Here, temperature
percentile values for the most recent month, along with previous 3-, 6-, 12-,
24-, 36-, and 48-month averages are shown for each climate division. Low percentile values (blue shading) indicate
cool conditions while high values (orange/red shading) indicate hot conditions.
For example, a temperature that falls at the 100th percentile means
that it is the highest average temperature for the 1895-present period.
The maps of the seven
periods for precipitation and temperature are shown below, with tables of the
percentile values and descriptive text following the maps. Current update is 03/29/2009. The data are preliminary.
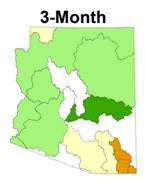
Precipitation Percentiles by Watershed (through
February 2009)
Temperature Percentiles by Climate
Division (through February 2009)
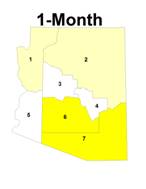

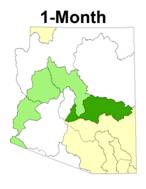
SHORT TERM CONDITIONS: 1-6 MONTHS
February
precipitation was near or slightly above average across northern and western
|
Watershed |
Precipitation Percentile |
Climate
Division |
Temperature Percentile |
|
Virgin |
25.64 |
CD1 |
64.78 |
|
|
41.03 |
CD2 |
68.70 |
|
Little |
43.59 |
CD3 |
59.57 |
|
Verde |
61.54 |
CD4 |
46.09 |
|
Bill
Williams |
66.67 |
CD5 |
50.00 |
|
|
57.69 |
CD6 |
80.43 |
|
|
56.41 |
CD7 |
81.74 |
|
Salt |
76.92 |
|
|
|
|
74.36 |
|
|
|
|
35.90 |
|
|
|
|
38.46 |
|
|
|
San Pedro |
38.46 |
|
|
|
Willcox
Playa |
26.32 |
|
|
|
San Simon |
56.41 |
|
|
|
White
Water Draw |
25.64 |
|
|
FEBRUARY 2009: percentiles of precipitation for the 15
|
Watershed |
Precipitation Percentile |
Climate
Division |
Temperature Percentile |
|
Virgin |
35.14 |
CD1 |
73.04 |
|
|
73.68 |
CD2 |
79.13 |
|
Little |
70.27 |
CD3 |
63.48 |
|
Verde |
59.46 |
CD4 |
57.39 |
|
Bill
Williams |
60.53 |
CD5 |
70.87 |
|
|
57.89 |
CD6 |
88.70 |
|
|
60.53 |
CD7 |
80.43 |
|
Salt |
76.32 |
|
|
|
|
71.05 |
|
|
|
|
47.37 |
|
|
|
|
39.47 |
|
|
|
San Pedro |
36.11 |
|
|
|
Willcox
Playa |
21.62 |
|
|
|
San Simon |
57.89 |
|
|
|
White
Water Draw |
24.32 |
|
|
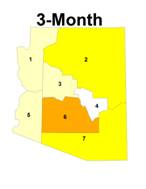
DECEMBER 2008 - FEBRUARY 2009
(3-month): percentiles of precipitation for
the 15
|
Watershed |
Precipitation Percentile |
Climate
Division |
Temperature Percentile |
|
Virgin |
15.71 |
CD1 |
79.13 |
|
|
47.37 |
CD2 |
85.22 |
|
Little |
32.43 |
CD3 |
83.04 |
|
Verde |
43.24 |
CD4 |
53.91 |
|
Bill
Williams |
44.74 |
CD5 |
95.65 |
|
|
42.11 |
CD6 |
97.39 |
|
|
42.11 |
CD7 |
75.65 |
|
Salt |
57.89 |
|
|
|
|
56.58 |
|
|
|
|
26.32 |
|
|
|
|
18.42 |
|
|
|
San Pedro |
22.22 |
|
|
|
Willcox
Playa |
16.22 |
|
|
|
San Simon |
28.95 |
|
|
|
White
Water Draw |
18.92 |
|
|
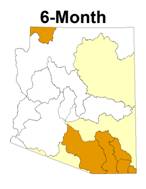
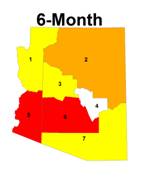
SEPTEMBER 2008 – FEBRUARY 2009
(6-month): percentiles of precipitation for
the 15
INTERMEDIATE
TERM CONDITIONS: 12-24 MONTHS
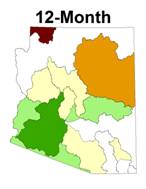
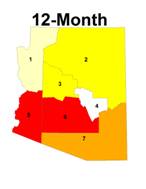
The 12-month period precipitation
was near or slightly below average in northwestern and southeastern
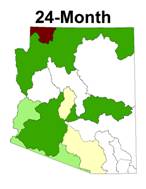
The 24 month period is
still the wettest long-term period, with all watersheds, except the Virgin,
Agua Fria and
Watershed |
Precipitation Percentile |
Climate
Division |
Temperature Percentile |
|
Virgin |
2.78 |
CD1 |
71.93 |
|
|
44.74 |
CD2 |
75.44 |
|
Little |
21.05 |
CD3 |
80.70 |
|
Verde |
31.58 |
CD4 |
44.30 |
|
Bill
Williams |
34.21 |
CD5 |
95.61 |
|
|
34.21 |
CD6 |
99.12 |
|
|
81.58 |
CD7 |
87.72 |
|
Salt |
65.79 |
|
|
|
|
60.53 |
|
|
|
|
50.00 |
|
|
|
|
28.95 |
|
|
|
San Pedro |
52.63 |
|
|
|
Willcox
Playa |
35.14 |
|
|
|
San Simon |
60.53 |
|
|
|
White
Water Draw |
40.54 |
|
|
MARCH 2008 – FEBRUARY 2009
(12-month): percentiles of precipitation for
the 15
|
Watershed |
Precipitation Percentile |
Climate
Division |
Temperature Percentile |
|
Virgin |
2.86 |
CD1 |
76.99 |
|
|
75.68 |
CD2 |
88.50 |
|
Little |
54.05 |
CD3 |
87.61 |
|
Verde |
43.24 |
CD4 |
78.76 |
|
Bill
Williams |
45.95 |
CD5 |
93.81 |
|
|
37.84 |
CD6 |
98.23 |
|
|
81.08 |
CD7 |
96.46 |
|
Salt |
81.08 |
|
|
|
|
62.16 |
|
|
|
|
59.46 |
|
|
|
|
32.43 |
|
|
|
San Pedro |
43.24 |
|
|
|
Willcox
Playa |
40.54 |
|
|
|
San Simon |
70.27 |
|
|
|
White
Water Draw |
40.54 |
|
|
MARCH 2007 – FEBRUARY 2009
(24-month): percentiles of precipitation for
the 15
LONG TERM
CONDITIONS: 36-48 MONTHS
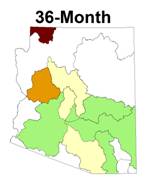
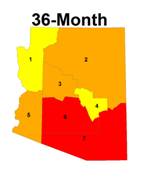
The 36-month period is
very different between the northern and southern halves of the state. In northern
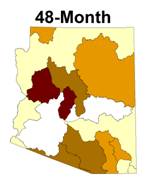
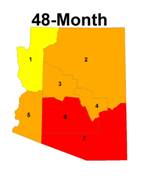
The 48-month period continues
to be the driest period, as the dry winter of 2008-2009 replaces the wet winter
of 2004-2005. All watersheds except the
Salt and lower Gila are below the 38th percentile. Nine watersheds are below the 23rd. The four-year temperatures continue to be extremely
high, with the five climate divisions above the 90th percentile, and
southern third of the state above the 99th percentile.
|
|
Precipitation Percentile |
Climate
Division |
Temperature Percentile |
|
Virgin |
2.94 |
CD1 |
76.34 |
|
|
44.44 |
CD2 |
86.61 |
|
Little |
52.78 |
CD3 |
89.29 |
|
Verde |
36.11 |
CD4 |
83.04 |
|
Bill
Williams |
22.22 |
CD5 |
91.07 |
|
|
27.78 |
CD6 |
98.21 |
|
|
75.00 |
CD7 |
98.21 |
|
Salt |
72.22 |
|
|
|
|
50.00 |
|
|
|
|
66.67 |
|
|
|
|
33.33 |
|
|
|
San Pedro |
63.89 |
|
|
|
Willcox
Playa |
58.33 |
|
|
|
San Simon |
50.00 |
|
|
|
White
Water Draw |
52.78 |
|
|
MARCH 2006 – FEBRUARY 2009
(36-month): percentiles of temperature, and
precipitation for the 15
|
Watershed |
Precipitation Percentile |
Climate
Division |
Temperature Percentile |
|
Virgin |
15.62 |
CD1 |
75.68 |
|
|
34.29 |
CD2 |
87.39 |
|
Little |
22.86 |
CD3 |
90.09 |
|
Verde |
11.43 |
CD4 |
90.09 |
|
Bill
Williams |
2.86 |
CD5 |
90.99 |
|
|
2.86 |
CD6 |
99.10 |
|
|
48.57 |
CD7 |
100.00 |
|
Salt |
42.86 |
|
|
|
|
31.43 |
|
|
|
|
28.57 |
|
|
|
|
5.71 |
|
|
|
San Pedro |
20.00 |
|
|
|
Willcox
Playa |
22.86 |
|
|
|
San Simon |
11.43 |
|
|
|
White
Water Draw |
37.14 |
|
|
MARCH 2005 – FEBRUARY 2009
(48-month): percentiles of temperature, and
precipitation for the 15
March 2008 Arizona Drought
Update based on precipitation data through February 2008)
The following
summary describes the heat and dryness across the state for the 1-, 3-, 6-,
12-, 24-, 36-, and 48-month periods.
SUMMARY
February
precipitation was near or slightly above average across northern and western
The 3-month period
of December through February was wetter than average for all but the
southeastern third of the state. The two
driest watersheds,
The 6-month period
precipitation was near average in the western half of the state, and in the
The 12-month period
precipitation was near or slightly below average in northwestern and
southeastern
The 24 month period
is still the wettest long-term period, with all watersheds, except the Virgin,
Agua Fria and
The 36-month period
is very different between the northern and southern halves of the state. In northern
The 48-month period
continues to be the driest period, as the dry winter of 2008-2009 replaces the
wet winter of 2004-2005. All watersheds
except the Salt and lower Gila are below the 38th percentile. Nine watersheds are below the 23rd. The four-year temperatures continue to be
extremely high, with the five climate divisions above the 90th percentile,
and southern third of the state above the 99th percentile.