State Precipitation &
Temperature Update for
Conditions through March 2007
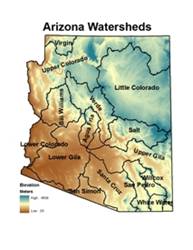
Precipitation
is monitored for the state of
Here, precipitation
percentile values for the most recent month, along with previous 3-, 6-, 12-,
24-, 36-, and 48-month total are shown for each watershed. Low percentile values (brown shading) indicate
dry conditions while high values (green shading) indicate wet conditions. For
example, a precipitation total that falls at the 100th percentile
means that it is the highest precipitation total for the 1971-present period.
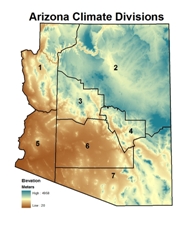 Temperature is monitored for the state of
Here, temperature
percentile values for the most recent month, along with previous 3-, 6-, 12-,
24-, 36-, and 48-month averages are shown for each climate division. Low percentile values (blue shading) indicate
cool conditions while high values (orange/red shading) indicate hot conditions.
For example, a temperature that falls at the 100th percentile means
that it is the highest average temperature for the 1895-present period.
The maps of the seven
periods for precipitation and temperature are shown below, with tables of the
percentile values and descriptive text following the maps. Current update is 4/25/2007. The data are preliminary, and some data are
missing from the Upper Colorado and
Precipitation Percentiles by Watershed
(through March 2007)
Temperature Percentiles by Climate
Division (through March 2007)

SHORT TERM CONDITIONS: 1-6 MONTHS
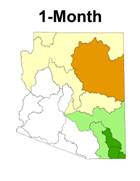
March precipitation
was below average across the northern half of the state, near normal in the
southwest and above average in the southeast watersheds. The near average precipitation in the Bill
Williams and
|
Watershed |
Precipitation Percentile |
Climate
Division |
Temperature Percentile |
|
Virgin |
32.43 |
CD1 |
94.69 |
|
|
37.84 |
CD2 |
93.81 |
|
Little |
21.62 |
CD3 |
92.04 |
|
Verde |
29.73 |
CD4 |
97.35 |
|
Bill
Williams |
43.24 |
CD5 |
92.04 |
|
|
43.24 |
CD6 |
92.04 |
|
|
54.05 |
CD7 |
89.38 |
|
Salt |
32.43 |
|
|
|
|
54.05 |
|
|
|
|
62.16 |
|
|
|
|
51.35 |
|
|
|
San Pedro |
64.86 |
|
|
|
Willcox
Playa |
78.38 |
|
|
|
San Simon |
48.65 |
|
|
|
White
Water Draw |
83.78 |
|
|
MARCH 2007: percentiles of precipitation for the 15
|
Watershed |
Precipitation Percentile |
Climate
Division |
Temperature Percentile |
|
Virgin |
19.44 |
CD1 |
85.84 |
|
|
21.62 |
CD2 |
69.47 |
|
Little |
25.00 |
CD3 |
66.37 |
|
Verde |
27.03 |
CD4 |
84.96 |
|
Bill
Williams |
18.92 |
CD5 |
65.93 |
|
|
35.14 |
CD6 |
84.96 |
|
|
35.14 |
CD7 |
50.44 |
|
Salt |
27.03 |
|
|
|
|
21.62 |
|
|
|
|
48.65 |
|
|
|
|
29.73 |
|
|
|
San Pedro |
51.35 |
|
|
|
Willcox
Playa |
55.56 |
|
|
|
San Simon |
27.03 |
|
|
|
White
Water Draw |
63.89 |
|
|
JANUARY 2006 - MARCH 2007 (3-month): percentiles of precipitation for the 15
|
Watershed |
Precipitation Percentile |
Climate
Division |
Temperature Percentile |
|
Virgin |
23.53 |
CD1 |
81.42 |
|
|
44.44 |
CD2 |
65.49 |
|
Little |
25.71 |
CD3 |
70.35 |
|
Verde |
28.57 |
CD4 |
76.11 |
|
Bill
Williams |
22.22 |
CD5 |
71.24 |
|
|
22.22 |
CD6 |
80.53 |
|
|
22.22 |
CD7 |
82.30 |
|
Salt |
22.22 |
|
|
|
|
22.22 |
|
|
|
|
36.11 |
|
|
|
|
13.89 |
|
|
|
San Pedro |
32.35 |
|
|
|
Willcox
Playa |
31.43 |
|
|
|
San Simon |
13.89 |
|
|
|
White
Water Draw |
40.00 |
|
|
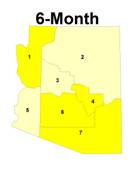
OCTOBER 2006 – MARCH 2007 (6-month): percentiles of precipitation for the 15
INTERMEDIATE
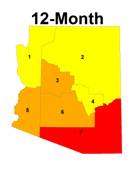
TERM CONDITIONS: 12-24 MONTHS
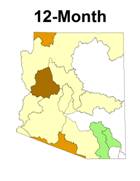
The western half of
the state continues to be very dry for the 12 month period that began in April
of 2006, with only the highest elevation watersheds of the Salt, upper Gila,
Little Colorado and southeastern
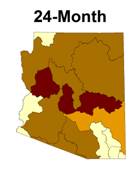
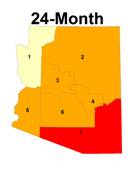
The two-year period map
again shows the longer term drought condition.
It seems that an occasional wet season, such as the winter of 2005 is
completely offset by an exceptionally dry season, such as the winter of 2006,
within the two year window. This
alternating of wet and dry years prevents the wet years from being effective in
alleviating the drought. The wettest
watersheds are at the 40th percentile, and the driest are below the
3rd percentile. For
temperature, all divisions except the northwest are above the 85th
percentile, exacerbating the dry conditions.
Again, the southeast climate division is the hot spot at the 100th
percentile.
Watershed |
Precipitation Percentile |
Climate
Division |
Temperature Percentile |
|
Virgin |
17.65 |
CD1 |
83.04 |
|
|
30.56 |
CD2 |
82.14 |
|
Little |
41.67 |
CD3 |
90.18 |
|
Verde |
27.78 |
CD4 |
80.36 |
|
Bill
Williams |
8.33 |
CD5 |
91.96 |
|
|
27.78 |
CD6 |
92.86 |
|
|
27.78 |
CD7 |
96.43 |
|
Salt |
30.56 |
|
|
|
|
33.33 |
|
|
|
|
55.56 |
|
|
|
|
36.11 |
|
|
|
San Pedro |
66.67 |
|
|
|
Willcox
Playa |
62.86 |
|
|
|
San Simon |
22.22 |
|
|
|
White
Water Draw |
60.00 |
|
|
APRIL 2006 – MARCH 2007 (12-month): percentiles of precipitation for the 15
|
Watershed |
Precipitation Percentile |
Climate
Division |
Temperature Percentile |
|
Virgin |
36.36 |
CD1 |
73.87 |
|
|
11.43 |
CD2 |
88.29 |
|
Little |
5.71 |
CD3 |
85.59 |
|
Verde |
8.57 |
CD4 |
92.79 |
|
Bill
Williams |
2.86 |
CD5 |
86.49 |
|
|
2.86 |
CD6 |
93.69 |
|
|
8.57 |
CD7 |
100.00 |
|
Salt |
2.86 |
|
|
|
|
37.14 |
|
|
|
|
17.14 |
|
|
|
|
14.29 |
|
|
|
San Pedro |
34.29 |
|
|
|
Willcox
Playa |
40.00 |
|
|
|
San Simon |
5.71 |
|
|
|
White
Water Draw |
40.00 |
|
|
APRIL 2005 – MARCH 2007 (24-month): percentiles of precipitation for the 15
LONG TERM
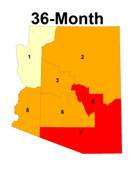
CONDITIONS: 36-48 MONTHS
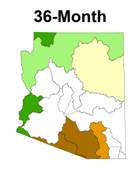
The 36-month precipitation
has now fallen below the 21st percentile for three watersheds in the south
central desert, and the Little Colorado watersheds is below the 40th
percentile. Only the Virgin, upper, and
lower
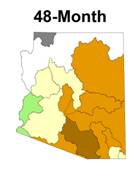
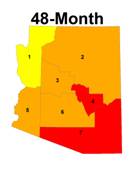
The 48-month
precipitation pattern shows the eastern parts of the state below the 25th
percentile, and the western desert only slightly better off just below the 40th
percentile. The upper and lower Colorado
River basins are near to slightly above average. Unfortunately, the long-term temperature
pattern remains unchanged, with all areas of the state above the 77th
percentile, with the hottest temperatures in
Watershed |
Precipitation Percentile |
Climate
Division |
Temperature Percentile |
|
Virgin |
84.38 |
CD1 |
73.18 |
|
|
67.65 |
CD2 |
88.18 |
|
Little |
38.24 |
CD3 |
86.82 |
|
Verde |
55.88 |
CD4 |
95.45 |
|
Bill
Williams |
52.94 |
CD5 |
86.36 |
|
|
44.12 |
CD6 |
90.91 |
|
|
52.94 |
CD7 |
98.18 |
|
Salt |
41.18 |
|
|
|
|
79.41 |
|
|
|
|
47.06 |
|
|
|
|
5.88 |
|
|
|
San Pedro |
20.59 |
|
|
|
Willcox
Playa |
41.18 |
|
|
|
San Simon |
11.76 |
|
|
|
White
Water Draw |
50.00 |
|
|
APRIL 2004 – MARCH 2007 (36-month): percentiles of temperature, and precipitation for the 15
|
Watershed |
Precipitation Percentile |
Climate
Division |
Temperature Percentile |
|
Virgin |
-99.99 |
CD1 |
77.06 |
|
|
48.48 |
CD2 |
89.91 |
|
Little |
21.21 |
CD3 |
91.74 |
|
Verde |
30.30 |
CD4 |
96.33 |
|
Bill
Williams |
33.33 |
CD5 |
89.45 |
|
|
21.21 |
CD6 |
93.58 |
|
|
39.39 |
CD7 |
100.00 |
|
Salt |
24.24 |
|
|
|
|
66.67 |
|
|
|
|
21.21 |
|
|
|
|
12.12 |
|
|
|
San Pedro |
18.18 |
|
|
|
Willcox
Playa |
18.18 |
|
|
|
San Simon |
21.21 |
|
|
|
White
Water Draw |
36.36 |
|
|
APRIL 2003 – MARCH 2007 (48-month): percentiles of temperature, and precipitation for the 15
April 2007
The
following summary describes the heat and dryness across the state for the 1-,
3-, 6-, 12-, 24-, 36-, and 48-month periods.
SUMMARY
March -
precipitation was below average across the northern half of the state, near
normal in the southwest and above average in the southeast watersheds. The near average precipitation in the Bill
Williams and
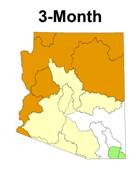
Three-month period
– The 3-month period of January through March was below the 25th
percentile for the upper, lower and Little Colorado watersheds, as well as the
Bill Williams in west central
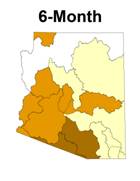
Six-month period
– Fall and winter precipitation, represented by the 6-month period of October
through March, was extremely dry, below the 44th percentile in all
watersheds, with the upper
Twelve-month period
– The western half of the state continues to be very dry for the 12 month
period that began in April of 2006, with only the highest elevation watersheds
of the Salt, upper Gila, Little Colorado and southeastern
Two-year period
- The two-year period map again shows the longer term drought condition. It seems that an occasional wet season, such
as the winter of 2005 is completely offset by an exceptionally dry season, such
as the winter of 2006, within the two year window. This alternating of wet and dry years
prevents the wet years from being effective in alleviating the drought. The wettest watersheds are at the 40th
percentile, and the driest are below the 3rd percentile. For temperature, all divisions except the
northwest are above the 85th percentile, exacerbating the dry
conditions. Again, the southeast climate
division is the hot spot at the 100th percentile.
Three-year period
- The 36-month precipitation has now fallen below the 21st percentile for three
watersheds in the south central desert, and the Little Colorado watersheds is
below the 40th percentile.
Only the Virgin, upper, and lower
Four-year period
- The 48-month precipitation pattern shows the eastern parts of the state below
the 25th percentile, and the western desert only slightly better off
just below the 40th percentile.
The upper and lower Colorado River basins are near to slightly above
average. Unfortunately, the long-term
temperature pattern remains unchanged, with all areas of the state above the 77th
percentile, with the hottest temperatures in