State Precipitation &
Temperature Update for
Conditions through March 2008
Precipitation
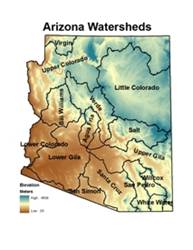
is monitored for the state of
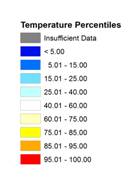
Here, precipitation
percentile values for the most recent month, along with previous 3-, 6-, 12-,
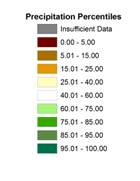
24-, 36-, and 48-month total are shown for each watershed. Low percentile values (brown shading) indicate
dry conditions while high values (green shading) indicate wet conditions. For
example, a precipitation total that falls at the 100th percentile
means that it is the highest precipitation total for the 1971-present period.
 Temperature is monitored for the state of
Here, temperature
percentile values for the most recent month, along with previous 3-, 6-, 12-,
24-, 36-, and 48-month averages are shown for each climate division. Low percentile values (blue shading) indicate
cool conditions while high values (orange/red shading) indicate hot conditions.
For example, a temperature that falls at the 100th percentile means
that it is the highest average temperature for the 1895-present period.
The maps of the seven
periods for precipitation and temperature are shown below, with tables of the
percentile values and descriptive text following the maps. Current update is 04/24/2008. The data are preliminary.
Precipitation Percentiles by Watershed
(through March 2008)
Temperature Percentiles by Climate
Division (through March 2008)
SHORT TERM CONDITIONS: 1-6 MONTHS
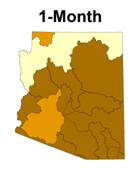
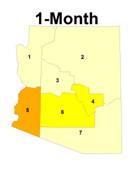
March was extremely
dry across the entire state. Precipitation
was below the 15th percentile for all watersheds except the upper
|
Watershed |
Precipitation Percentile |
Climate
Division |
Temperature Percentile |
|
Virgin |
18.42 |
CD1 |
72.37 |
|
|
26.32 |
CD2 |
65.79 |
|
Little |
10.53 |
CD3 |
74.56 |
|
Verde |
10.53 |
CD4 |
82.89 |
|
Bill
Williams |
13.16 |
CD5 |
85.09 |
|
|
13.16 |
CD6 |
82.89 |
|
|
15.79 |
CD7 |
64.91 |
|
Salt |
5.26 |
|
|
|
|
7.89 |
|
|
|
|
7.89 |
|
|
|
|
13.16 |
|
|
|
San Pedro |
10.53 |
|
|
|
Willcox
Playa |
10.53 |
|
|
|
San Simon |
13.16 |
|
|
|
White
Water Draw |
5.26 |
|
|
MARCH 2008: percentiles of precipitation for the 15
|
Watershed |
Precipitation Percentile |
Climate
Division |
Temperature Percentile |
|
Virgin |
35.14 |
CD1 |
55.26 |
|
|
76.32 |
CD2 |
34.65 |
|
Little |
62.16 |
CD3 |
44.30 |
|
Verde |
60.53 |
CD4 |
64.04 |
|
Bill
Williams |
60.53 |
CD5 |
61.84 |
|
|
57.89 |
CD6 |
57.89 |
|
|
60.53 |
CD7 |
61.40 |
|
Salt |
65.79 |
|
|
|
|
50.00 |
|
|
|
|
39.47 |
|
|
|
|
34.21 |
|
|
|
San Pedro |
23.68 |
|
|
|
Willcox
Playa |
18.92 |
|
|
|
San Simon |
47.37 |
|
|
|
White
Water Draw |
18.92 |
|
|
JANUARY 2008 - MARCH 2008 (3-month): percentiles of precipitation for the 15
|
Watershed |
Precipitation Percentile |
Climate
Division |
Temperature Percentile |
|
Virgin |
34.29 |
CD1 |
62.28 |
|
|
70.27 |
CD2 |
61.40 |
|
Little |
55.56 |
CD3 |
67.54 |
|
Verde |
58.33 |
CD4 |
89.47 |
|
Bill
Williams |
48.65 |
CD5 |
70.18 |
|
|
56.76 |
CD6 |
78.95 |
|
|
67.57 |
CD7 |
82.46 |
|
Salt |
64.86 |
|
|
|
|
51.35 |
|
|
|
|
45.95 |
|
|
|
|
51.35 |
|
|
|
San Pedro |
40.00 |
|
|
|
Willcox
Playa |
30.56 |
|
|
|
San Simon |
62.16 |
|
|
|
White
Water Draw |
33.33 |
|
|
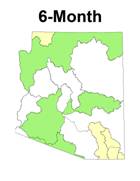
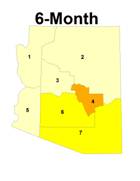
OCTOBER 2008 – MARCH 2008 (6-month): percentiles of precipitation for the 15
INTERMEDIATE
TERM CONDITIONS: 12-24 MONTHS
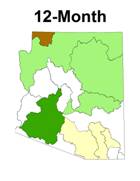
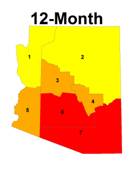
The 12-month period had
near- to above-average precipitation in 11 watersheds, and below-average
precipitation in the Virgin,
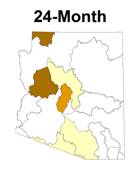
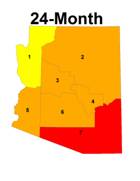
The 24-month period was
much drier than it was last month, with no watersheds above the 59th
percentile. Three watersheds are still at
or below the 25th percentile, nine are between the 40th
and 59th percentiles, while last month six watersheds were above the
60th percentile. Temperatures
for the 24-month period warmed above the 86th percentile everywhere
but the northwest, where they dropped slightly to the 78th
percentile.
Watershed |
Precipitation Percentile |
Climate
Division |
Temperature Percentile |
|
Virgin |
8.57 |
CD1 |
76.99 |
|
|
72.97 |
CD2 |
82.74 |
|
Little |
64.86 |
CD3 |
90.27 |
|
Verde |
54.05 |
CD4 |
93.81 |
|
Bill
Williams |
45.95 |
CD5 |
88.50 |
|
|
45.95 |
CD6 |
95.58 |
|
|
75.68 |
CD7 |
96.46 |
|
Salt |
70.27 |
|
|
|
|
59.46 |
|
|
|
|
51.35 |
|
|
|
|
35.14 |
|
|
|
San Pedro |
35.14 |
|
|
|
Willcox
Playa |
36.11 |
|
|
|
San Simon |
56.76 |
|
|
|
White
Water Draw |
41.67 |
|
|
APRIL 2008 – MARCH 2008 (12-month): percentiles of precipitation for the 15
|
Watershed |
Precipitation Percentile |
Climate
Division |
Temperature Percentile |
|
Virgin |
8.82 |
CD1 |
77.68 |
|
|
44.44 |
CD2 |
90.18 |
|
Little |
55.56 |
CD3 |
92.86 |
|
Verde |
30.56 |
CD4 |
91.96 |
|
Bill Williams |
13.89 |
CD5 |
92.86 |
|
|
25.00 |
CD6 |
93.75 |
|
|
52.78 |
CD7 |
97.32 |
|
Salt |
47.22 |
|
|
|
|
41.67 |
|
|
|
|
47.22 |
|
|
|
|
33.33 |
|
|
|
San Pedro |
44.44 |
|
|
|
Willcox
Playa |
58.33 |
|
|
|
San Simon |
38.89 |
|
|
|
White
Water Draw |
58.33 |
|
|
APRIL 2007 – MARCH 2008 (24-month): percentiles of precipitation for the 15
LONG TERM
CONDITIONS: 36-48 MONTHS
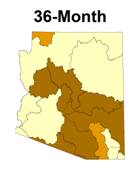
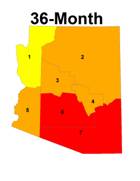
The 36-month period continues
to be the driest period with all watersheds below the 35th percentile. Nine watersheds are below the 22nd
percentile with seven below the 15th percentile. The Northwest climate division is above the
75th percentile and the other six climate divisions are above the 88th
percentile. Division 7 had its warmest
4-year period since 1895.
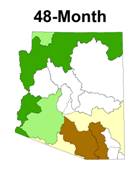
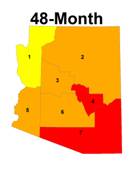
The 48-month period continues
to have above-average precipitation in the western watersheds, below-average
precipitation in the southeastern watersheds, and near- average precipitation
in the central watersheds.
|
|
Precipitation Percentile |
Climate
Division |
Temperature Percentile |
|
Virgin |
21.21 |
CD1 |
75.23 |
|
|
31.43 |
CD2 |
88.29 |
|
Little |
25.71 |
CD3 |
90.99 |
|
Verde |
14.29 |
CD4 |
94.59 |
|
Bill
Williams |
5.71 |
CD5 |
88.29 |
|
|
5.71 |
CD6 |
97.30 |
|
|
28.57 |
CD7 |
100.00 |
|
Salt |
14.29 |
|
|
|
|
25.71 |
|
|
|
|
14.29 |
|
|
|
|
8.57 |
|
|
|
San Pedro |
20.00 |
|
|
|
Willcox
Playa |
31.43 |
|
|
|
San Simon |
8.57 |
|
|
|
White
Water Draw |
34.29 |
|
|
APRIL 2006 – MARCH 2008 (36-month): percentiles of temperature, and precipitation for the 15
|
Watershed |
Precipitation Percentile |
Climate
Division |
Temperature Percentile |
|
Virgin |
61.29 |
CD1 |
75.45 |
|
|
76.47 |
CD2 |
88.18 |
|
Little |
44.12 |
CD3 |
87.73 |
|
Verde |
58.82 |
CD4 |
95.45 |
|
Bill
Williams |
50.00 |
CD5 |
86.36 |
|
|
47.06 |
CD6 |
91.82 |
|
|
61.76 |
CD7 |
99.09 |
|
Salt |
47.06 |
|
|
|
|
76.47 |
|
|
|
|
35.29 |
|
|
|
|
8.82 |
|
|
|
San Pedro |
14.71 |
|
|
|
Willcox
Playa |
41.18 |
|
|
|
San Simon |
29.41 |
|
|
|
White
Water Draw |
47.06 |
|
|
APRIL 2005 – MARCH 2008 (48-month): percentiles of temperature, and precipitation for the 15
April 2008 Arizona Drought
Update based on precipitation data through March 2008)
The
following summary describes the heat and dryness across the state for the 1-,
3-, 6-, 12-, 24-, 36-, and 48-month periods.
SUMMARY
March
was extremely dry across the entire state.
Precipitation was below the 15th percentile for all
watersheds except the upper
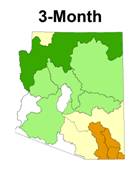
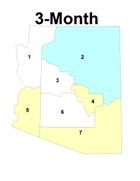
The 3-month winter
period of January through March was wetter than average across the northwest
2/3 of the state, and drier than average in the southeastern third of the
state. Virtually all of that
precipitation fell in January and February.
The three month period was near average in central and northwestern
The 6-month period
precipitation, from October through March, was near- to slightly above-average
in most watersheds. The northwest and
southeast corners of the state saw few winter storms and received below average
precipitation this winter. The northern
half of the state had winter temperatures between the 61st and 71st
percentile, while the southern half of the state had temperatures between the
78th and 90th percentiles. Overall, the temperature conditions matched
the
The 12-month period
had near- to above-average precipitation in 11 watersheds, and below-average
precipitation in the Virgin,
The 24-month period
was much drier than it was last month, with no watersheds above the 59th
percentile. Three watersheds are still
at or below the 25th percentile, nine are between the 40th
and 59th percentiles, while last month six watersheds were above the
60th percentile. Temperatures
for the 24-month period warmed above the 86th percentile everywhere
but the northwest, where they dropped slightly to the 78th
percentile.
The 36-month period
continues to be the driest period with all watersheds below the 35th
percentile. Nine watersheds are below
the 22nd percentile with seven below the 15th
percentile. The Northwest climate
division is above the 75th percentile and the other six climate
divisions are above the 88th percentile. Division 7 had its warmest 4-year period
since 1895.
The 48-month period continues
to have above-average precipitation in the western watersheds, below-average
precipitation in the southeastern watersheds, and near- average precipitation
in the central watersheds.