State Precipitation &
Temperature Update for
Conditions through April 2007
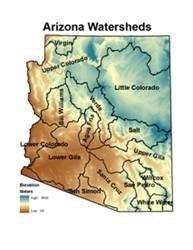
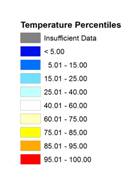
Precipitation
is monitored for the state of
Here, precipitation
percentile values for the most recent month, along with previous 3-, 6-, 12-,
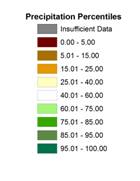
24-, 36-, and 48-month total are shown for each watershed. Low percentile values (brown shading) indicate
dry conditions while high values (green shading) indicate wet conditions. For
example, a precipitation total that falls at the 100th percentile
means that it is the highest precipitation total for the 1971-present period.
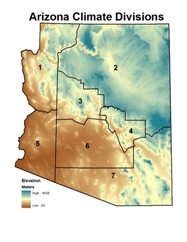 Temperature is monitored for the state of
Here, temperature
percentile values for the most recent month, along with previous 3-, 6-, 12-,
24-, 36-, and 48-month averages are shown for each climate division. Low percentile values (blue shading) indicate
cool conditions while high values (orange/red shading) indicate hot conditions.
For example, a temperature that falls at the 100th percentile means
that it is the highest average temperature for the 1895-present period.
The maps of the seven
periods for precipitation and temperature are shown below, with tables of the
percentile values and descriptive text following the maps. Current update is 4528/2007. The data are preliminary, and some data are
missing from the San Pedro and
Precipitation Percentiles by Watershed
(through April 2007)
Temperature Percentiles by Climate
Division (through April 2007)
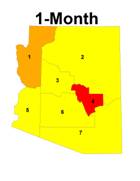
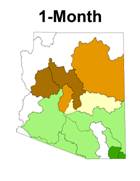
SHORT TERM CONDITIONS: 1-6 MONTHS
April brought three
different precipitation regimes to the state.
The northernmost watersheds had near average precipitation, while the
watersheds across central
|
Watershed |
Precipitation Percentile |
Climate
Division |
Temperature Percentile |
|
Virgin |
54.05 |
CD1 |
87.17 |
|
|
43.24 |
CD2 |
82.74 |
|
Little |
21.62 |
CD3 |
80.97 |
|
Verde |
13.51 |
CD4 |
95.58 |
|
Bill
Williams |
13.51 |
CD5 |
75.22 |
|
|
21.62 |
CD6 |
76.99 |
|
|
64.86 |
CD7 |
78.76 |
|
Salt |
37.84 |
|
|
|
|
55.41 |
|
|
|
|
62.16 |
|
|
|
|
64.86 |
|
|
|
San Pedro |
54.05 |
|
|
|
Willcox
Playa |
70.27 |
|
|
|
San Simon |
70.27 |
|
|
|
White Water
Draw |
78.38 |
|
|
APRIL 2007: percentiles of precipitation for the 15
|
Watershed |
Precipitation Percentile |
Climate
Division |
Temperature Percentile |
|
Virgin |
21.62 |
CD1 |
93.81 |
|
|
24.32 |
CD2 |
95.58 |
|
Little |
16.22 |
CD3 |
88.50 |
|
Verde |
21.62 |
CD4 |
95.58 |
|
Bill
Williams |
18.92 |
CD5 |
84.07 |
|
|
27.03 |
CD6 |
92.04 |
|
|
32.43 |
CD7 |
82.30 |
|
Salt |
27.03 |
|
|
|
|
37.84 |
|
|
|
|
37.84 |
|
|
|
|
24.32 |
|
|
|
San Pedro |
35.14 |
|
|
|
Willcox
Playa |
50.00 |
|
|
|
San Simon |
29.73 |
|
|
|
White
Water Draw |
56.76 |
|
|
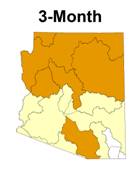
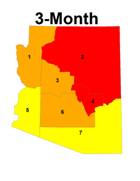
FEBRUARY 2006 - APRIL 2007 (3-month): percentiles of precipitation for the 15
|
Watershed |
Precipitation Percentile |
Climate
Division |
Temperature Percentile |
|
Virgin |
14.71 |
CD1 |
86.73 |
|
|
16.67 |
CD2 |
78.76 |
|
Little |
11.43 |
CD3 |
76.99 |
|
Verde |
14.29 |
CD4 |
89.38 |
|
Bill
Williams |
8.33 |
CD5 |
77.88 |
|
|
13.89 |
CD6 |
83.19 |
|
|
16.67 |
CD7 |
81.86 |
|
Salt |
16.67 |
|
|
|
|
16.67 |
|
|
|
|
33.33 |
|
|
|
|
11.11 |
|
|
|
San Pedro |
35.29 |
|
|
|
Willcox
Playa |
45.71 |
|
|
|
San Simon |
11.11 |
|
|
|
White
Water Draw |
48.57 |
|
|
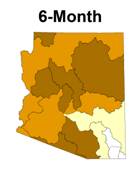
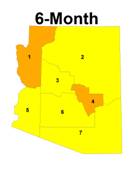
NOVEMBER 2006 – APRIL 2007 (6-month): percentiles of precipitation for the 15
INTERMEDIATE
TERM CONDITIONS: 12-24 MONTHS
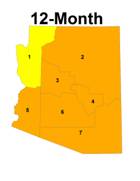
The western deserts
and Verde watershed continue to have well below average precipitation for the
12 month period that began in May of 2006, with watersheds on the Colorado
Plateau having only slightly below average precipitation. The San Pedro, Willcox Playa, and White Water
Draw watersheds remain above average, mostly as a result of the wet monsoon in
2006. Temperatures for the previous 12
months continue to be well above average, with all climate divisions remaining
above the 84th percentile.
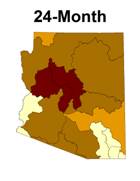
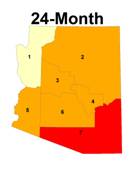
The two-year period has
shown very little improvement over last month with the
Watershed |
Precipitation Percentile |
Climate
Division |
Temperature Percentile |
|
Virgin |
23.53 |
CD1 |
84.82 |
|
|
33.33 |
CD2 |
85.71 |
|
Little |
27.78 |
CD3 |
85.71 |
|
Verde |
19.44 |
CD4 |
91.07 |
|
Bill
Williams |
5.56 |
CD5 |
91.96 |
|
|
22.22 |
CD6 |
91.07 |
|
|
25.00 |
CD7 |
92.86 |
|
Salt |
33.33 |
|
|
|
|
33.33 |
|
|
|
|
55.56 |
|
|
|
|
41.67 |
|
|
|
San Pedro |
66.67 |
|
|
|
Willcox Playa |
65.71 |
|
|
|
San Simon |
22.22 |
|
|
|
White
Water Draw |
62.86 |
|
|
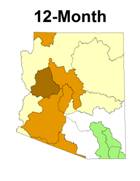
MAY 2006 – APRIL 2007 (12-month): percentiles of precipitation for the 15
|
Watershed |
Precipitation Percentile |
Climate
Division |
Temperature Percentile |
|
Virgin |
21.21 |
CD1 |
74.77 |
|
|
8.57 |
CD2 |
90.09 |
|
Little |
5.71 |
CD3 |
89.19 |
|
Verde |
2.86 |
CD4 |
92.79 |
|
Bill
Williams |
2.86 |
CD5 |
90.09 |
|
|
2.86 |
CD6 |
94.59 |
|
|
8.57 |
CD7 |
100.00 |
|
Salt |
5.71 |
|
|
|
|
28.57 |
|
|
|
|
17.14 |
|
|
|
|
11.43 |
|
|
|
San Pedro |
34.29 |
|
|
|
Willcox
Playa |
40.00 |
|
|
|
San Simon |
5.71 |
|
|
|
White
Water Draw |
40.00 |
|
|
MAY 2005 – APRIL 2007 (24-month): percentiles of precipitation for the 15
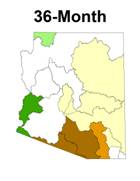
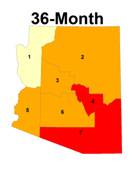
LONG TERM
CONDITIONS: 36-48 MONTHS
The 36-month precipitation
is well below average in the south central deserts and slightly below normal in
most other watersheds. Since last
month’s update, the northern and western watersheds have dropped from above to
near average precipitation for the 3-year period. The 36-month-temperature pattern continues
unchanged for the past four updates, with
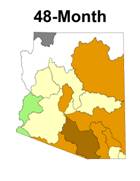
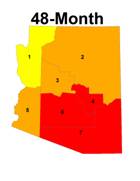
The eastern watersheds
remain below the 25th percentile for the 48-month period. The only change from last month’s update is
the
Watershed |
Precipitation Percentile |
Climate
Division |
Temperature Percentile |
|
Virgin |
75.00 |
CD1 |
74.55 |
|
|
58.82 |
CD2 |
89.09 |
|
Little |
29.41 |
CD3 |
86.36 |
|
Verde |
44.12 |
CD4 |
95.45 |
|
Bill Williams |
41.18 |
CD5 |
86.36 |
|
|
32.35 |
CD6 |
91.82 |
|
|
47.06 |
CD7 |
97.27 |
|
Salt |
38.24 |
|
|
|
|
76.47 |
|
|
|
|
32.35 |
|
|
|
|
5.88 |
|
|
|
San Pedro |
20.59 |
|
|
|
Willcox
Playa |
38.24 |
|
|
|
San Simon |
8.82 |
|
|
|
White
Water Draw |
47.06 |
|
|
MAY 2004 – APRIL 2007 (36-month): percentiles of temperature, and precipitation for the 15
|
Watershed |
Precipitation Percentile |
Climate
Division |
Temperature Percentile |
|
Virgin |
-99.99 |
CD1 |
77.98 |
|
|
48.48 |
CD2 |
91.74 |
|
Little |
21.21 |
CD3 |
93.58 |
|
Verde |
30.30 |
CD4 |
96.33 |
|
Bill
Williams |
27.27 |
CD5 |
90.83 |
|
|
21.21 |
CD6 |
97.25 |
|
|
39.39 |
CD7 |
100.00 |
|
Salt |
27.27 |
|
|
|
|
66.67 |
|
|
|
|
24.24 |
|
|
|
|
12.12 |
|
|
|
San Pedro |
15.15 |
|
|
|
Willcox
Playa |
18.18 |
|
|
|
San Simon |
21.21 |
|
|
|
White
Water Draw |
36.36 |
|
|
MAY 2003 – APRIL 2007 (48-month): percentiles of temperature, and precipitation for the 15
May 2007
The
following summary describes the heat and dryness across the state for the 1-,
3-, 6-, 12-, 24-, 36-, and 48-month periods.
SUMMARY
April
brought three different precipitation regimes to the state. The northernmost watersheds had near average
precipitation, while the watersheds across central
Three-month period
– Precipitation for the 3-month period of February through April was below the
40th percentile everywhere in the state except the southeast
corner. The combination of extremely dry
conditions and temperatures above the 95th percentile on the
Colorado Plateau during the past 3 months hastened the snowmelt and contributed
to dangerous fire conditions.
Six-month period
– The 6-month precipitation map shows the effects of the dry fall and winter
with only five watersheds above the 25th percentile and only two
above the 40th percentile.
Temperatures were above the 75th percentile everywhere in the
state for the 6-month period, probably as a result of the lack of winter
storms.
Twelve-month period
– The western deserts and Verde watershed continue to have well below average
precipitation for the 12 month period that began in May of 2006, with
watersheds on the Colorado Plateau having only slightly below average
precipitation. The San Pedro, Willcox
Playa, and White Water Draw watersheds remain above average, mostly as a result
of the wet monsoon in 2006. Temperatures
for the previous 12 months continue to be well above average, with all climate
divisions remaining above the 84th percentile.
Two-year period
- The two-year period has shown very little improvement over last month with
the
Three-year period
- The 36-month precipitation is well below average in the south central deserts
and slightly below normal in most other watersheds. Since last month’s update, the northern and
western watersheds have dropped from above to near average precipitation for
the 3-year period. The 36-month-temperature
pattern continues unchanged for the past four updates, with
Four-year period
- The eastern watersheds remain below the 25th percentile for the
48-month period. The only change from
last month’s update is the