State Precipitation &
Temperature Update for
Conditions through May 2008
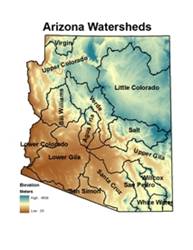
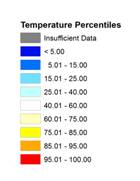
Precipitation
is monitored for the state of
Here, precipitation
percentile values for the most recent month, along with previous 3-, 6-, 12-,
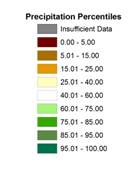
24-, 36-, and 48-month total are shown for each watershed. Low percentile values (brown shading) indicate
dry conditions while high values (green shading) indicate wet conditions. For
example, a precipitation total that falls at the 100th percentile
means that it is the highest precipitation total for the 1971-present period.
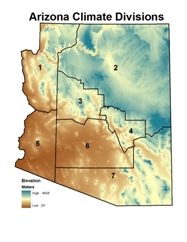 Temperature is monitored for the state of
Here, temperature
percentile values for the most recent month, along with previous 3-, 6-, 12-,
24-, 36-, and 48-month averages are shown for each climate division. Low percentile values (blue shading) indicate
cool conditions while high values (orange/red shading) indicate hot conditions.
For example, a temperature that falls at the 100th percentile means
that it is the highest average temperature for the 1895-present period.
The maps of the seven
periods for precipitation and temperature are shown below, with tables of the
percentile values and descriptive text following the maps. Current update is 06/23/2008. The data are preliminary.
Precipitation Percentiles by Watershed
(through May 2008)
Temperature Percentiles by Climate
Division (through May 2008)
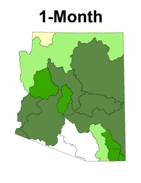
SHORT TERM CONDITIONS: 1-6 MONTHS
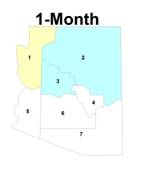
May is normally very
dry statewide, but this year it was exceptionally wet in many locations, as
three wet low pressure systems moved across the state. Some of the higher elevations even had
snow. Precipitation was above the 52nd
percentile for all watersheds except the Virgin in NW Arizona. The wettest watershed was the Little Colorado,
at the 86th percentile. As a
result of the storm systems, which brought unseasonably cold air, all climate
divisions except the NW had temperatures near or below average for the
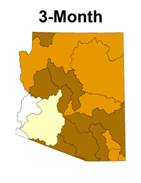
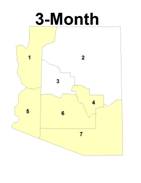
month. The three-month period of March
through May was drier than average, since both March and April were very dry
across the state. The lower
|
Watershed |
Precipitation Percentile |
Climate
Division |
Temperature Percentile |
|
Virgin |
31.58 |
CD1 |
62.72 |
|
|
63.16 |
CD2 |
29.39 |
|
Little |
86.84 |
CD3 |
28.07 |
|
Verde |
85.53 |
CD4 |
50.88 |
|
Bill
Williams |
81.58 |
CD5 |
55.26 |
|
|
84.21 |
CD6 |
45.18 |
|
|
94.74 |
CD7 |
44.74 |
|
Salt |
94.74 |
|
|
|
|
92.11 |
|
|
|
|
89.47 |
|
|
|
|
52.63 |
|
|
|
San Pedro |
73.68 |
|
|
|
Willcox
Playa |
81.58 |
|
|
|
San Simon |
57.89 |
|
|
|
White
Water Draw |
76.32 |
|
|
MAY 2008: percentiles of precipitation for the 15
|
Watershed |
Precipitation Percentile |
Climate
Division |
Temperature Percentile |
|
Virgin |
5.26 |
CD1 |
69.30 |
|
|
21.05 |
CD2 |
43.86 |
|
Little |
15.79 |
CD3 |
53.51 |
|
Verde |
10.53 |
CD4 |
70.18 |
|
Bill
Williams |
13.16 |
CD5 |
65.35 |
|
|
7.89 |
CD6 |
66.67 |
|
|
31.58 |
CD7 |
60.09 |
|
Salt |
15.79 |
|
|
|
|
50.00 |
|
|
|
|
13.16 |
|
|
|
|
10.53 |
|
|
|
San Pedro |
13.16 |
|
|
|
Willcox
Playa |
18.42 |
|
|
|
San Simon |
13.16 |
|
|
|
White
Water Draw |
21.05 |
|
|
MARCH 2008 - MAY 2008 (3-month): percentiles of precipitation for the 15
|
Watershed |
Precipitation Percentile |
Climate
Division |
Temperature Percentile |
|
Virgin |
50.00 |
CD1 |
53.51 |
|
|
75.68 |
CD2 |
30.70 |
|
Little |
77.78 |
CD3 |
39.47 |
|
Verde |
63.89 |
CD4 |
62.28 |
|
Bill
Williams |
64.86 |
CD5 |
46.93 |
|
|
67.57 |
CD6 |
46.93 |
|
|
75.68 |
CD7 |
52.19 |
|
Salt |
78.38 |
|
|
|
|
64.86 |
|
|
|
|
62.16 |
|
|
|
|
59.46 |
|
|
|
San Pedro |
48.57 |
|
|
|
Willcox
Playa |
47.22 |
|
|
|
San Simon |
72.97 |
|
|
|
White
Water Draw |
50.00 |
|
|
DECEMBER 2008 – MAY 2008 (6-month): percentiles of precipitation for the 15
INTERMEDIATE
TERM CONDITIONS: 12-24 MONTHS
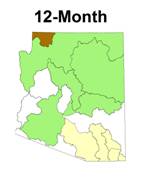
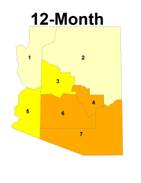
The 12-month period had
near- or below-average precipitation in 5 watersheds in west central and
southeastern
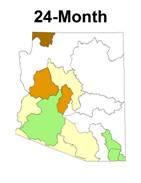
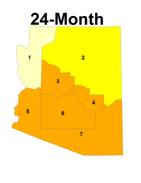
The 24-month period was
slightly wetter than last month, with three watersheds now above average for
the 24-month period. The lower Gila,
Willcox Playa and Whitewater Draw have moved up to the 61st
percentile. The rest of the state is
near or slightly below average, with the Bill Williams and
Watershed |
Precipitation Percentile |
Climate
Division |
Temperature Percentile |
|
Virgin |
5.71 |
CD1 |
70.80 |
|
|
70.27 |
CD2 |
71.68 |
|
Little |
70.27 |
CD3 |
82.30 |
|
Verde |
62.16 |
CD4 |
89.38 |
|
Bill
Williams |
45.95 |
CD5 |
79.65 |
|
|
51.35 |
CD6 |
85.84 |
|
|
70.27 |
CD7 |
88.50 |
|
Salt |
72.97 |
|
|
|
|
59.46 |
|
|
|
|
45.95 |
|
|
|
|
37.84 |
|
|
|
San Pedro |
37.84 |
|
|
|
Willcox
Playa |
33.33 |
|
|
|
San Simon |
54.05 |
|
|
|
White
Water Draw |
38.89 |
|
|
JUNE 2008 – MAY 2008 (12-month): percentiles of precipitation for the 15
|
Watershed |
Precipitation Percentile |
Climate
Division |
Temperature Percentile |
|
Virgin |
5.88 |
CD1 |
75.00 |
|
|
47.22 |
CD2 |
79.02 |
|
Little |
58.33 |
CD3 |
86.61 |
|
Verde |
33.33 |
CD4 |
88.39 |
|
Bill
Williams |
16.67 |
CD5 |
87.50 |
|
|
22.22 |
CD6 |
91.07 |
|
|
61.11 |
CD7 |
92.86 |
|
Salt |
55.56 |
|
|
|
|
38.89 |
|
|
|
|
52.78 |
|
|
|
|
36.11 |
|
|
|
San Pedro |
52.78 |
|
|
|
Willcox
Playa |
61.11 |
|
|
|
San Simon |
38.89 |
|
|
|
White
Water Draw |
61.11 |
|
|
JUNE 2007 – MAY 2008 (24-month): percentiles of precipitation for the 15
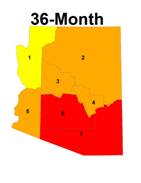
LONG TERM
CONDITIONS: 36-48 MONTHS
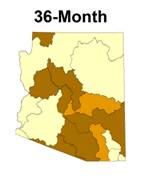
The 36-month period is
the driest long-term period, with most of the southeast and central watersheds
at or below the 20th percentile.
All watersheds remain below the 32nd percentile, and seven
watersheds are below the 15th percentile. For temperature, the southeast climate
divisions remain above the 95th percentile and even the coolest
climate division, in the northwest, is still above the 75th
percentile.
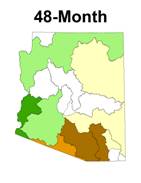
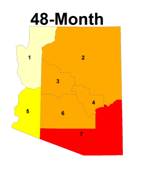
The 48-month period had
dry conditions in the southeast, and near average conditions in central
|
|
Precipitation Percentile |
Climate
Division |
Temperature Percentile |
|
Virgin |
9.09 |
CD1 |
75.23 |
|
|
31.43 |
CD2 |
88.29 |
|
Little |
28.57 |
CD3 |
89.19 |
|
Verde |
11.43 |
CD4 |
92.79 |
|
Bill
Williams |
5.71 |
CD5 |
90.09 |
|
|
5.71 |
CD6 |
95.50 |
|
|
28.57 |
CD7 |
100.00 |
|
Salt |
20.00 |
|
|
|
|
31.43 |
|
|
|
|
14.29 |
|
|
|
|
8.57 |
|
|
|
San Pedro |
17.14 |
|
|
|
Willcox
Playa |
31.43 |
|
|
|
San Simon |
5.71 |
|
|
|
White
Water Draw |
31.43 |
|
|
JUNE 2006 – MAY 2008 (36-month): percentiles of temperature, and precipitation for the 15
|
Watershed |
Precipitation Percentile |
Climate
Division |
Temperature Percentile |
|
Virgin |
45.16 |
CD1 |
74.55 |
|
|
70.59 |
CD2 |
88.18 |
|
Little |
38.24 |
CD3 |
86.36 |
|
Verde |
58.82 |
CD4 |
94.55 |
|
Bill
Williams |
47.06 |
CD5 |
83.64 |
|
|
41.18 |
CD6 |
90.91 |
|
|
63.24 |
CD7 |
98.18 |
|
Salt |
44.12 |
|
|
|
|
76.47 |
|
|
|
|
32.35 |
|
|
|
|
8.82 |
|
|
|
San Pedro |
11.76 |
|
|
|
Willcox
Playa |
35.29 |
|
|
|
San Simon |
17.65 |
|
|
|
White
Water Draw |
41.18 |
|
|
JUNE 2005 – MAY 2008 (48-month): percentiles of temperature, and precipitation for the 15
June 2008
The
following summary describes the heat and dryness across the state for the 1-,
3-, 6-, 12-, 24-, 36-, and 48-month periods.
SUMMARY
May
is normally very dry statewide, but this year it was exceptionally wet in many
locations, as three wet low pressure systems moved across the state. Some of the higher elevations even had
snow. Precipitation was above the 52nd
percentile for all watersheds except the Virgin in NW Arizona. The wettest watershed was the Little
Colorado, at the 86th percentile.
As a result of the storm systems, which brought unseasonably cold air,
all climate divisions except the NW had temperatures near or below average for
the month.
The 3-month
period of March through May was drier than average, since both March and April
were very dry across the state. The
lower
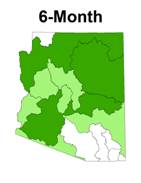
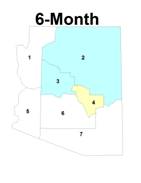
The 6-month period
precipitation, from December through May, was near average in the southeast and
above average in the rest of the state, due to the wet months of December
through February. Ten watersheds were
between the 62nd and 79th percentiles. The driest watersheds, in the southeast,
should start to recover as the monsoon develops. Temperatures were near average in the
southern and western parts of the state, and cooler than average on the
Colorado Plateau.
The 12-month period
had near- or below-average precipitation in 5 watersheds in west central and
southeastern
The 24-month period
was slightly wetter than last month, with three watersheds now above average
for the 24-month period. The lower Gila,
Willcox Playa and Whitewater Draw have moved up to the 61st
percentile. The rest of the state is
near or slightly below average, with the Bill Williams and
The 36-month period
is the driest long-term period, with most of the southeast and central
watersheds at or below the 20th percentile. All watersheds remain below the 32nd
percentile, and seven watersheds are below the 15th percentile. For temperature, the southeast climate
divisions remain above the 95th percentile and even the coolest
climate division, in the northwest, is still above the 75th
percentile.
The 48-month period
had dry conditions in the southeast, and near average conditions in central