State Precipitation &
Temperature Update for
Conditions through June 2008
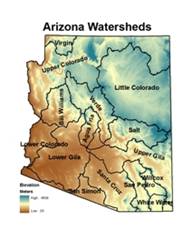
Precipitation
is monitored for the state of
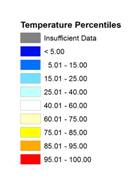
Here, precipitation
percentile values for the most recent month, along with previous 3-, 6-, 12-,
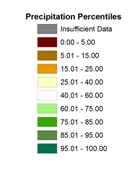
24-, 36-, and 48-month total are shown for each watershed. Low percentile values (brown shading) indicate
dry conditions while high values (green shading) indicate wet conditions. For
example, a precipitation total that falls at the 100th percentile
means that it is the highest precipitation total for the 1971-present period.
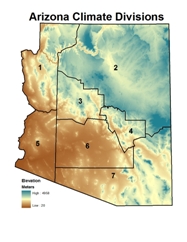 Temperature is monitored for the state of
Here, temperature
percentile values for the most recent month, along with previous 3-, 6-, 12-,
24-, 36-, and 48-month averages are shown for each climate division. Low percentile values (blue shading) indicate
cool conditions while high values (orange/red shading) indicate hot conditions.
For example, a temperature that falls at the 100th percentile means
that it is the highest average temperature for the 1895-present period.
The maps of the seven
periods for precipitation and temperature are shown below, with tables of the
percentile values and descriptive text following the maps. Current update is 07/21/2008. The data are preliminary.
Precipitation Percentiles by Watershed
(through June 2008)
Temperature Percentiles by Climate
Division (through June 2008)
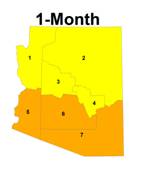
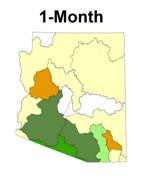
SHORT TERM CONDITIONS: 1-6 MONTHS
June is normally dry
statewide, unless the monsoon activity begins early. This year the rainfall began early in
southern
|
Watershed |
Precipitation Percentile |
Climate
Division |
Temperature Percentile |
|
Virgin |
45.95 |
CD1 |
84.65 |
|
|
36.84 |
CD2 |
79.82 |
|
Little |
36.84 |
CD3 |
82.89 |
|
Verde |
34.21 |
CD4 |
77.63 |
|
Bill
Williams |
18.42 |
CD5 |
92.98 |
|
|
42.11 |
CD6 |
93.86 |
|
|
92.11 |
CD7 |
92.11 |
|
Salt |
55.26 |
|
|
|
|
30.26 |
|
|
|
|
26.32 |
|
|
|
|
86.84 |
|
|
|
San Pedro |
65.79 |
|
|
|
Willcox
Playa |
23.68 |
|
|
|
San Simon |
84.21 |
|
|
|
White
Water Draw |
26.32 |
|
|
JUNE 2008: percentiles of precipitation for the 15
|
Watershed |
Precipitation Percentile |
Climate
Division |
Temperature Percentile |
|
Virgin |
8.11 |
CD1 |
73.45 |
|
|
26.32 |
CD2 |
52.63 |
|
Little |
36.84 |
CD3 |
57.46 |
|
Verde |
23.68 |
CD4 |
71.05 |
|
Bill
Williams |
28.95 |
CD5 |
73.68 |
|
|
28.95 |
CD6 |
70.18 |
|
|
81.58 |
CD7 |
70.61 |
|
Salt |
63.16 |
|
|
|
|
84.21 |
|
|
|
|
47.37 |
|
|
|
|
47.37 |
|
|
|
San Pedro |
52.63 |
|
|
|
Willcox
Playa |
28.95 |
|
|
|
San Simon |
47.37 |
|
|
|
White
Water Draw |
28.95 |
|
|
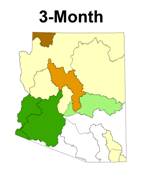
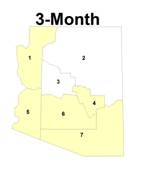
APRIL 2008 - JUNE 2008 (3-month): percentiles of precipitation for the 15
|
Watershed |
Precipitation Percentile |
Climate
Division |
Temperature Percentile |
|
Virgin |
16.67 |
CD1 |
66.37 |
|
|
68.42 |
CD2 |
44.74 |
|
Little |
51.35 |
CD3 |
57.89 |
|
Verde |
44.74 |
CD4 |
67.54 |
|
Bill Williams |
52.63 |
CD5 |
70.18 |
|
|
44.74 |
CD6 |
69.30 |
|
|
57.89 |
CD7 |
79.82 |
|
Salt |
65.79 |
|
|
|
|
52.63 |
|
|
|
|
31.58 |
|
|
|
|
28.95 |
|
|
|
San Pedro |
26.32 |
|
|
|
Willcox
Playa |
17.57 |
|
|
|
San Simon |
44.74 |
|
|
|
White
Water Draw |
8.11 |
|
|
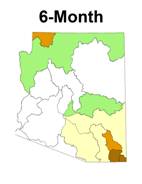
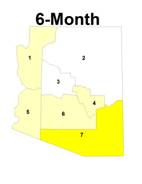
JANUARY 2008 – JUNE 2008 (6-month): percentiles of precipitation for the 15
INTERMEDIATE
TERM CONDITIONS: 12-24 MONTHS
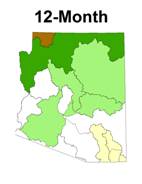
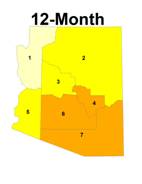
The 12-month period had
above-average precipitation in five watersheds in the northeast and southwest
parts of the state, near-average precipitation in six watersheds in central and
southern
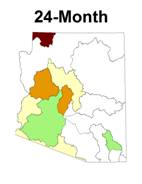
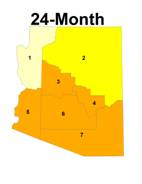
The 24-month period has
seven watersheds near average for precipitation in the eastern half of the
state, with two watersheds, the lower Gila and Willcox Playa, above average. Six watersheds are below average, with three
between the 30th and 39th percentiles, and 3 below the 22nd
percentile, all in the western half of
Watershed |
Precipitation Percentile |
Climate
Division |
Temperature Percentile |
|
Virgin |
5.71 |
CD1 |
73.45 |
|
|
75.68 |
CD2 |
75.22 |
|
Little |
70.27 |
CD3 |
77.88 |
|
Verde |
64.86 |
CD4 |
86.28 |
|
Bill
Williams |
45.95 |
CD5 |
79.65 |
|
|
51.35 |
CD6 |
87.61 |
|
|
72.97 |
CD7 |
92.04 |
|
Salt |
72.97 |
|
|
|
|
59.46 |
|
|
|
|
43.24 |
|
|
|
|
40.54 |
|
|
|
San Pedro |
32.43 |
|
|
|
Willcox
Playa |
27.78 |
|
|
|
San Simon |
54.05 |
|
|
|
White
Water Draw |
27.78 |
|
|
JULY 2008 – JUNE 2008 (12-month): percentiles of precipitation for the 15
|
Watershed |
Precipitation Percentile |
Climate
Division |
Temperature Percentile |
|
Virgin |
2.94 |
CD1 |
73.21 |
|
|
47.22 |
CD2 |
78.57 |
|
Little |
58.33 |
CD3 |
85.71 |
|
Verde |
30.56 |
CD4 |
85.71 |
|
Bill
Williams |
16.67 |
CD5 |
87.50 |
|
|
22.22 |
CD6 |
89.29 |
|
|
61.11 |
CD7 |
94.64 |
|
Salt |
55.56 |
|
|
|
|
38.89 |
|
|
|
|
52.78 |
|
|
|
|
41.67 |
|
|
|
San Pedro |
52.78 |
|
|
|
Willcox
Playa |
61.11 |
|
|
|
San Simon |
36.11 |
|
|
|
White
Water Draw |
58.33 |
|
|
JULY 2007 – JUNE 2008 (24-month): percentiles of precipitation for the 15
LONG TERM
CONDITIONS: 36-48 MONTHS
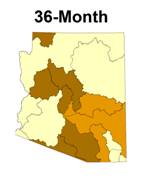
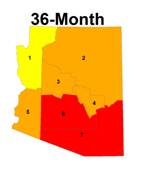
The 36-month period continues
to be the driest long-term period, with five central and southern watersheds
below the 12th percentile. Nine
watersheds remain below the 25th percentile, and all are below the
35th percentile. For
temperature, the two southeast climate divisions remain above the 95th
percentile while all the others are between the 76th and 93rd
percentiles. Climate division 7 had the
hottest 36-month period on record.
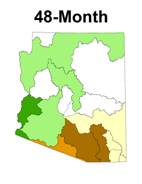
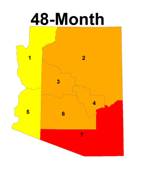
The 48-month period includes
the wet winter of 2005 and is the wettest of the three long-term periods (24-,
36-, and 48-month). However, a
comparison of the 36- and 48-month maps shows that the precipitation
distribution was not uniform. Even
though 2005 was wet in the northern watersheds, it was very dry in the
southeast, as were the 36- and 12-month periods. Only four watersheds are above the 60th
percentile, while six watersheds are below the 40th percentile for
the long-term. Again all climate
divisions are above the 75th percentile for temperature, and the
southeastern climate division is the hottest, but not quite the hottest on
record. It is not a coincidence that the
hottest climate divisions match up with the driest watersheds, and the coolest
area match up with the wettest watersheds.
The presence of cold fronts and cloudy conditions associated with
precipitation tend to hold temperatures down.
Unfortunately when temperatures climb due to clear skies and the absence
of frontal systems, the higher temperatures increase the demand for soil
moisture in evaporation and plant transpiration, worsening the impacts of
drought on rangeland vegetation.
|
|
Precipitation Percentile |
Climate
Division |
Temperature Percentile |
|
Virgin |
9.09 |
CD1 |
76.58 |
|
|
31.43 |
CD2 |
88.29 |
|
Little |
28.57 |
CD3 |
90.09 |
|
Verde |
11.43 |
CD4 |
92.79 |
|
Bill
Williams |
5.71 |
CD5 |
87.39 |
|
|
5.71 |
CD6 |
95.50 |
|
|
28.57 |
CD7 |
100.00 |
|
Salt |
20.00 |
|
|
|
|
34.29 |
|
|
|
|
17.14 |
|
|
|
|
11.43 |
|
|
|
San Pedro |
20.00 |
|
|
|
Willcox
Playa |
28.57 |
|
|
|
San Simon |
8.57 |
|
|
|
White
Water Draw |
34.29 |
|
|
JULY 2006 – JUNE 2008 (36-month): percentiles of temperature, and precipitation for the 15
|
Watershed |
Precipitation Percentile |
Climate
Division |
Temperature Percentile |
|
Virgin |
43.75 |
CD1 |
75.45 |
|
|
67.65 |
CD2 |
90.00 |
|
Little |
41.18 |
CD3 |
86.36 |
|
Verde |
61.76 |
CD4 |
94.55 |
|
Bill
Williams |
47.06 |
CD5 |
84.55 |
|
|
41.18 |
CD6 |
90.00 |
|
|
64.71 |
CD7 |
99.09 |
|
Salt |
44.12 |
|
|
|
|
76.47 |
|
|
|
|
35.29 |
|
|
|
|
11.76 |
|
|
|
San Pedro |
11.76 |
|
|
|
Willcox
Playa |
35.29 |
|
|
|
San Simon |
20.59 |
|
|
|
White
Water Draw |
38.24 |
|
|
JULY 2005 – JUNE 2008 (48-month): percentiles of temperature, and precipitation for the 15
July 2008
The
following summary describes the heat and dryness across the state for the 1-,
3-, 6-, 12-, 24-, 36-, and 48-month periods.
SUMMARY
June
is normally dry statewide, unless the monsoon activity begins early. This year the rainfall began early in
southern
The 3-month
period of April through June was drier than average in the northern half of the
state, and near- or above-average in the southern half of the state. The notable dry exceptions in the southeast
are the Willcox and Whitewater Draw watersheds, which remain below the 30th
percentile. There is definite short-term
improvement, as last month the three month interval was the driest of all the
intervals, with 8 watersheds below the 15th percentile, and 12
watersheds below the 25th percentile. The three-month temperatures continue to be
near- or slightly above-average.
The 6-month period
precipitation, from January through June, was near average in the central
watersheds, above average in the Salt and
The 12-month period
had above-average precipitation in five watersheds in the northeast and
southwest parts of the state, near-average precipitation in six watersheds in
central and southern
The 24-month period
has seven watersheds near average for precipitation in the eastern half of the
state, with two watersheds, the lower Gila and Willcox Playa, above
average. Six watersheds are below
average, with three between the 30th and 39th
percentiles, and three below the 22nd percentile, all in the western
half of
The 36-month period
continues to be the driest long-term period, with five central and southern
watersheds below the 12th percentile. Nine watersheds remain below the 25th
percentile, and all are below the 35th percentile. For temperature, the two southeast climate
divisions remain above the 95th percentile while all the others are
between the 76th and 93rd percentiles. Climate division 7 had the hottest 36-month
period on record.
The 48-month period
includes the wet winter of 2005 and is the wettest of the three long-term
periods (24-, 36-, and 48-month).
However, a comparison of the 36- and 48-month maps shows that the
precipitation distribution was not uniform.
Even though 2005 was wet in the northern watersheds, it was very dry in
the southeast, as were the 36- and 12-month periods. Only four watersheds are above the 60th
percentile, while six watersheds are below the 40th percentile for
the long-term. Again all climate
divisions are above the 75th percentile for temperature, and the
southeastern climate division is the hottest, but not quite the hottest on
record. It is not a coincidence that the
hottest climate divisions match up with the driest watersheds, and the coolest
area match up with the wettest watersheds.
The presence of cold fronts and cloudy conditions associated with
precipitation tend to hold temperatures down.
Unfortunately when temperatures climb due to clear skies and the absence
of frontal systems, the higher temperatures increase the demand for soil
moisture in evaporation and plant transpiration, worsening the impacts of
drought on rangeland vegetation.