State Precipitation &
Temperature Update for
Conditions through July 2007
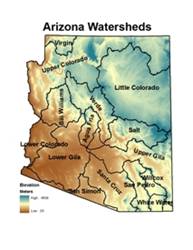
Precipitation
is monitored for the state of
Here, precipitation
percentile values for the most recent month, along with previous 3-, 6-, 12-,
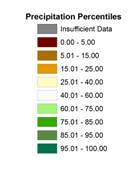
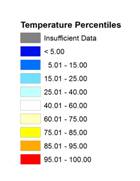
24-, 36-, and 48-month total are shown for each watershed. Low percentile values (brown shading) indicate
dry conditions while high values (green shading) indicate wet conditions. For
example, a precipitation total that falls at the 100th percentile
means that it is the highest precipitation total for the 1971-present period.
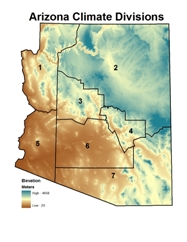 Temperature is monitored for the state of
Here, temperature
percentile values for the most recent month, along with previous 3-, 6-, 12-,
24-, 36-, and 48-month averages are shown for each climate division. Low percentile values (blue shading) indicate
cool conditions while high values (orange/red shading) indicate hot conditions.
For example, a temperature that falls at the 100th percentile means
that it is the highest average temperature for the 1895-present period.
The maps of the seven
periods for precipitation and temperature are shown below, with tables of the
percentile values and descriptive text following the maps. Current update is 8/25/2007. The data are preliminary.
Precipitation Percentiles by Watershed
(through July 2007)
Temperature Percentiles by Climate
Division (through July 2007)
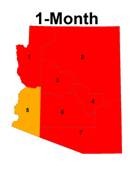
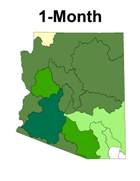
SHORT TERM CONDITIONS: 1-6 MONTHS
July is generally a wet
month across
|
Watershed |
Precipitation Percentile |
Climate
Division |
Temperature Percentile |
|
Virgin |
38.89 |
CD1 |
97.35 |
|
|
91.89 |
CD2 |
98.23 |
|
Little |
89.19 |
CD3 |
99.12 |
|
Verde |
91.89 |
CD4 |
99.12 |
|
Bill
Williams |
81.08 |
CD5 |
92.04 |
|
|
91.89 |
CD6 |
99.12 |
|
|
97.30 |
CD7 |
96.46 |
|
Salt |
94.59 |
|
|
|
|
94.59 |
|
|
|
|
72.97 |
|
|
|
|
75.68 |
|
|
|
San Pedro |
67.57 |
|
|
|
Willcox
Playa |
62.16 |
|
|
|
San Simon |
91.89 |
|
|
|
White
Water Draw |
55.56 |
|
|
JULY 2007: percentiles of precipitation for the 15
|
Watershed |
Precipitation Percentile |
Climate
Division |
Temperature Percentile |
|
Virgin |
5.56 |
CD1 |
93.81 |
|
|
86.49 |
CD2 |
94.69 |
|
Little |
81.08 |
CD3 |
93.81 |
|
Verde |
81.08 |
CD4 |
98.23 |
|
Bill
Williams |
64.86 |
CD5 |
89.38 |
|
|
81.08 |
CD6 |
94.69 |
|
|
97.30 |
CD7 |
94.69 |
|
Salt |
78.38 |
|
|
|
|
94.59 |
|
|
|
|
67.57 |
|
|
|
|
70.27 |
|
|
|
San Pedro |
54.05 |
|
|
|
Willcox
Playa |
56.76 |
|
|
|
San Simon |
91.89 |
|
|
|
White
Water Draw |
55.56 |
|
|
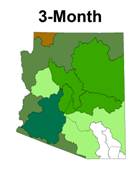
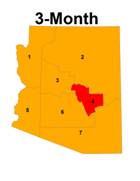
MAY 2006 - JULY 2007 (3-month): percentiles of precipitation for the 15
|
Watershed |
Precipitation Percentile |
Climate
Division |
Temperature Percentile |
|
Virgin |
11.11 |
CD1 |
92.92 |
|
|
43.24 |
CD2 |
96.46 |
|
Little |
37.84 |
CD3 |
96.46 |
|
Verde |
27.03 |
CD4 |
94.69 |
|
Bill
Williams |
18.92 |
CD5 |
92.04 |
|
|
35.14 |
CD6 |
95.58 |
|
|
70.27 |
CD7 |
94.69 |
|
Salt |
29.73 |
|
|
|
|
64.86 |
|
|
|
|
45.95 |
|
|
|
|
37.84 |
|
|
|
San Pedro |
40.54 |
|
|
|
Willcox
Playa |
52.78 |
|
|
|
San Simon |
56.76 |
|
|
|
White
Water Draw |
58.33 |
|
|
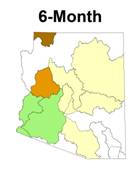
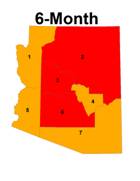
FEBRUARY 2006 – JULY 2007 (6-month): percentiles of precipitation for the 15
INTERMEDIATE
TERM CONDITIONS: 12-24 MONTHS
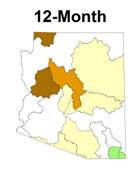
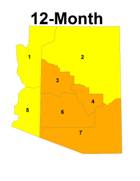
The 12-month period
reflects winter of 2006-07 and the end of the 2006 monsoon season. For all watersheds in the state except White
Water Draw and Willcox Playa in the southeast, the 12 month period was very
dry. The
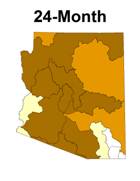
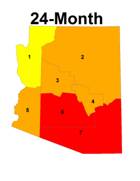
The two-year period
precipitation continues to be well below-average for all watersheds except
White Water Draw. The rest of the state
is below the 46th percentile and 11 watersheds are at or below the
20th percentile. This period
includes two dry winters, one normal monsoon in 2006 and a dry monsoon in 2005. The entire state was very warm during the
past 24 months, with a north-south temperature gradient. The high temperatures have increased the
evaporative demand for water, reducing the water available for recharge.
Watershed |
Precipitation Percentile |
Climate
Division |
Temperature Percentile |
|
Virgin |
12.12 |
CD1 |
81.25 |
|
|
44.44 |
CD2 |
79.91 |
|
Little |
30.56 |
CD3 |
85.71 |
|
Verde |
25.00 |
CD4 |
85.71 |
|
Bill
Williams |
5.56 |
CD5 |
82.14 |
|
|
36.11 |
CD6 |
87.05 |
|
|
44.44 |
CD7 |
91.07 |
|
Salt |
33.33 |
|
|
|
|
44.44 |
|
|
|
|
50.00 |
|
|
|
|
27.78 |
|
|
|
San Pedro |
47.22 |
|
|
|
Willcox
Playa |
60.00 |
|
|
|
San Simon |
38.89 |
|
|
|
White
Water Draw |
66.67 |
|
|
AUGUST 2006 – JULY 2007 (12-month): percentiles of precipitation for the 15
|
Watershed |
Precipitation Percentile |
Climate
Division |
Temperature Percentile |
|
Virgin |
18.18 |
CD1 |
78.38 |
|
|
14.29 |
CD2 |
90.09 |
|
Little |
17.14 |
CD3 |
90.99 |
|
Verde |
8.57 |
CD4 |
91.89 |
|
Bill
Williams |
5.71 |
CD5 |
90.09 |
|
|
5.71 |
CD6 |
97.30 |
|
|
11.43 |
CD7 |
100.00 |
|
Salt |
8.57 |
|
|
|
|
34.29 |
|
|
|
|
20.00 |
|
|
|
|
14.29 |
|
|
|
San Pedro |
34.29 |
|
|
|
Willcox
Playa |
45.71 |
|
|
|
San Simon |
5.71 |
|
|
|
White
Water Draw |
54.29 |
|
|
AUGUST 2005 – JULY 2007 (24-month): percentiles of precipitation for the 15
LONG TERM
CONDITIONS: 36-48 MONTHS
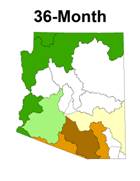
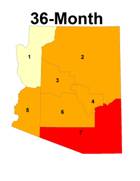
The 36-month precipitation
period adds a wet winter to the two dry winters, and a second dry monsoon,
resulting in a pattern of drier than average conditions in the southern half of
the state, average precipitation in the central watersheds, and wetter than average
conditions in the northern and western watersheds. The 36-month-temperature pattern continues
to show the southeast climate division as the hottest in 37 years and all but
the northwestern climate division are above the 88th percentile.
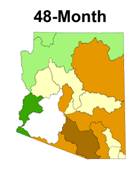
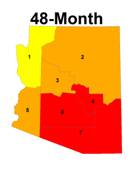
The 48-month map continues
to show much drier than average conditions everywhere except the northernmost
and westernmost watersheds. Six of the
eastern and central watersheds are below the 25th percentile. Temperatures in the southern climate
divisions are above the 95th percentile, and the northern and
western climate divisions are above the 77th percentile.
Watershed |
Precipitation Percentile |
Climate
Division |
Temperature Percentile |
|
Virgin |
75.76 |
CD1 |
74.55 |
|
|
76.47 |
CD2 |
88.18 |
|
Little |
41.18 |
CD3 |
88.18 |
|
Verde |
52.94 |
CD4 |
94.55 |
|
Bill
Williams |
50.00 |
CD5 |
85.45 |
|
|
41.18 |
CD6 |
94.55 |
|
|
64.71 |
CD7 |
99.09 |
|
Salt |
41.18 |
|
|
|
|
82.35 |
|
|
|
|
38.24 |
|
|
|
|
8.82 |
|
|
|
San Pedro |
17.65 |
|
|
|
Willcox
Playa |
41.18 |
|
|
|
San Simon |
20.59 |
|
|
|
White
Water Draw |
47.06 |
|
|
AUGUST 2004 – JULY 2007 (36-month): percentiles of temperature, and precipitation for the 15
|
Watershed |
Precipitation Percentile |
Climate
Division |
Temperature Percentile |
|
Virgin |
64.52 |
CD1 |
77.98 |
|
|
66.67 |
CD2 |
89.91 |
|
Little |
21.21 |
CD3 |
94.50 |
|
Verde |
36.36 |
CD4 |
95.41 |
|
Bill
Williams |
39.39 |
CD5 |
88.07 |
|
|
21.21 |
CD6 |
98.17 |
|
|
51.52 |
CD7 |
100.00 |
|
Salt |
27.27 |
|
|
|
|
75.76 |
|
|
|
|
24.24 |
|
|
|
|
9.09 |
|
|
|
San Pedro |
21.21 |
|
|
|
Willcox
Playa |
27.27 |
|
|
|
San Simon |
24.24 |
|
|
|
White
Water Draw |
36.36 |
|
|
AUGUST 2003 – JULY 2007 (48-month): percentiles of temperature, and precipitation for the 15
August 2007
The
following summary describes the heat and dryness across the state for the 1-,
3-, 6-, 12-, 24-, 36-, and 48-month periods.
SUMMARY
July is generally
a wet month across
Three-month period
– For the 3-month period of May through July, precipitation was also well above
average, for most of the state. Only the
Six-month period
– spans the dry winter from February through the wet summer month of July, with
most watersheds either slightly above or slightly below average
precipitation. Temperatures were above
the 85th percentile everywhere in the state, and above the 95thth
percentile in the central and northeastern climate divisions.
Twelve-month period
– reflects winter of 2006-07 and the end of the 2006 monsoon season. For all watersheds in the state except White
Water Draw and Willcox Playa in the southeast, the 12 month period was very
dry. The
Two-year period
- precipitation continues to be well below-average for all watersheds except
White Water Draw. The rest of the state
is below the 46th percentile and 11 watersheds are at or below the
20th percentile. This period
includes two dry winters, one normal monsoon in 2006 and a dry monsoon in
2005. The entire state was very warm
during the past 24 months, with a north-south temperature gradient. The high temperatures have increased the
evaporative demand for water, reducing the water available for recharge.
Three-year period
- The 36-month precipitation period adds a wet winter to the two dry winters,
and a second dry monsoon, resulting in a pattern of drier than average
conditions in the southern half of the state, average precipitation in the
central watersheds, and wetter than average conditions in the northern and
western watersheds. The 36-month-temperature
pattern continues to show the southeast climate division as the hottest in 37
years and all but the northwestern climate division are above the 88th
percentile.
Four-year period
- The 48-month map continues to show much drier than average conditions
everywhere except the northernmost and westernmost watersheds. Six of the eastern and central watersheds are
below the 25th percentile.
Temperatures in the southern climate divisions are above the 95th
percentile, and the northern and western climate divisions are above the 77th
percentile.