State Precipitation &
Temperature Update for
Conditions through July 2008
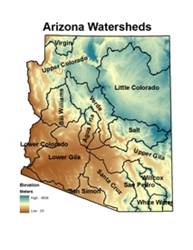
Precipitation
is monitored for the state of
Here, precipitation
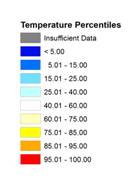
percentile values for the most recent month, along with previous 3-, 6-, 12-,
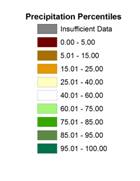
24-, 36-, and 48-month total are shown for each watershed. Low percentile values (brown shading) indicate
dry conditions while high values (green shading) indicate wet conditions. For
example, a precipitation total that falls at the 100th percentile
means that it is the highest precipitation total for the 1971-present period.
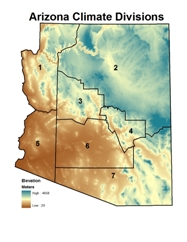 Temperature is monitored for the state of
Here, temperature
percentile values for the most recent month, along with previous 3-, 6-, 12-,
24-, 36-, and 48-month averages are shown for each climate division. Low percentile values (blue shading) indicate
cool conditions while high values (orange/red shading) indicate hot conditions.
For example, a temperature that falls at the 100th percentile means
that it is the highest average temperature for the 1895-present period.
The maps of the seven
periods for precipitation and temperature are shown below, with tables of the
percentile values and descriptive text following the maps. Current update is 08/26/2008. The data are preliminary.
Precipitation Percentiles by Watershed
(through July 2008)
Temperature Percentiles by Climate
Division (through July 2008)
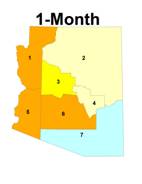

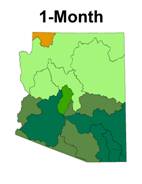
SHORT TERM CONDITIONS: 1-6 MONTHS
Although July is typically
one of
|
Watershed |
Precipitation Percentile |
Climate
Division |
Temperature Percentile |
|
Virgin |
16.22 |
CD1 |
89.47 |
|
|
71.05 |
CD2 |
72.81 |
|
Little |
73.68 |
CD3 |
75.88 |
|
Verde |
63.16 |
CD4 |
66.67 |
|
Bill
Williams |
73.68 |
CD5 |
91.23 |
|
|
76.32 |
CD6 |
90.35 |
|
|
97.37 |
CD7 |
32.02 |
|
Salt |
94.74 |
|
|
|
|
85.53 |
|
|
|
|
97.37 |
|
|
|
|
89.47 |
|
|
|
San Pedro |
100.00 |
|
|
|
Willcox
Playa |
100.00 |
|
|
|
San Simon |
89.47 |
|
|
|
White
Water Draw |
97.30 |
|
|
JULY 2008: percentiles of precipitation for the 15
|
Watershed |
Precipitation Percentile |
Climate
Division |
Temperature Percentile |
|
Virgin |
5.41 |
CD1 |
77.43 |
|
|
63.16 |
CD2 |
60.96 |
|
Little |
78.95 |
CD3 |
63.60 |
|
Verde |
65.79 |
CD4 |
68.86 |
|
Bill
Williams |
71.05 |
CD5 |
88.60 |
|
|
78.95 |
CD6 |
80.26 |
|
|
97.37 |
CD7 |
57.02 |
|
Salt |
97.37 |
|
|
|
|
92.11 |
|
|
|
|
97.37 |
|
|
|
|
89.47 |
|
|
|
San Pedro |
100.00 |
|
|
|
Willcox
Playa |
94.74 |
|
|
|
San Simon |
92.11 |
|
|
|
White
Water Draw |
86.49 |
|
|
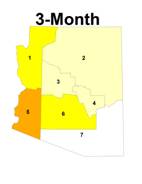
MAY 2008 - JULY 2008 (3-month): percentiles of precipitation for the 15
|
Watershed |
Precipitation Percentile |
Climate
Division |
Temperature Percentile |
|
Virgin |
8.11 |
CD1 |
69.91 |
|
|
36.84 |
CD2 |
56.14 |
|
Little |
42.11 |
CD3 |
64.91 |
|
Verde |
23.68 |
CD4 |
64.91 |
|
Bill
Williams |
26.32 |
CD5 |
81.14 |
|
|
26.32 |
CD6 |
76.75 |
|
|
73.68 |
CD7 |
86.84 |
|
Salt |
50.00 |
|
|
|
|
39.47 |
|
|
|
|
65.79 |
|
|
|
|
57.89 |
|
|
|
San Pedro |
84.21 |
|
|
|
Willcox
Playa |
72.97 |
|
|
|
San Simon |
55.26 |
|
|
|
White
Water Draw |
64.86 |
|
|
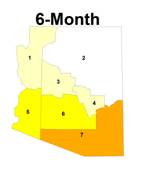
FEBRUARY 2008 – JULY 2008 (6-month): percentiles of precipitation for the 15
INTERMEDIATE
TERM CONDITIONS: 12-24 MONTHS
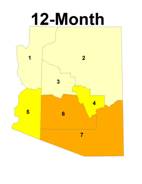
The 12-month period precipitation
is highly variable around the state, with near or above average precipitation
in all watersheds except the Virgin and lower
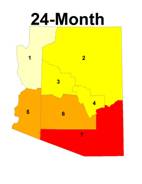
The 24-month period now
has only four watersheds at or below the 25th percentile, and they
are scattered across the state from the north to the south. Three watersheds in the southern half of the
state are above average, between the 66th and 73rd
percentile. The other eight watersheds
are near or slightly below average for the two-year period. Temperatures for the 24-month period are essentially
unchanged from last month’s update, with all climate divisions above the 73rd
percentile.
Watershed |
Precipitation Percentile |
Climate
Division |
Temperature Percentile |
|
Virgin |
5.88 |
CD1 |
72.12 |
|
|
70.27 |
CD2 |
69.03 |
|
Little |
59.46 |
CD3 |
74.34 |
|
Verde |
48.65 |
CD4 |
84.96 |
|
Bill
Williams |
43.24 |
CD5 |
79.65 |
|
|
45.95 |
CD6 |
86.73 |
|
|
75.68 |
CD7 |
92.92 |
|
Salt |
72.97 |
|
|
|
|
37.84 |
|
|
|
|
59.46 |
|
|
|
|
51.35 |
|
|
|
San Pedro |
62.16 |
|
|
|
Willcox
Playa |
50.00 |
|
|
|
San Simon |
56.76 |
|
|
|
White
Water Draw |
48.65 |
|
|
AUGUST 2008 – JULY 2008 (12-month): percentiles of precipitation for the 15
|
Watershed |
Precipitation Percentile |
Climate
Division |
Temperature Percentile |
|
Virgin |
2.94 |
CD1 |
73.21 |
|
|
50.00 |
CD2 |
77.68 |
|
Little |
44.44 |
CD3 |
84.82 |
|
Verde |
30.56 |
CD4 |
83.04 |
|
Bill
Williams |
16.67 |
CD5 |
88.39 |
|
|
25.00 |
CD6 |
87.05 |
|
|
66.67 |
CD7 |
95.54 |
|
Salt |
58.33 |
|
|
|
|
38.89 |
|
|
|
|
58.33 |
|
|
|
|
25.00 |
|
|
|
San Pedro |
50.00 |
|
|
|
Willcox
Playa |
72.22 |
|
|
|
San Simon |
38.89 |
|
|
|
White Water
Draw |
66.67 |
|
|
AUGUST 2007 – JULY 2008 (24-month): percentiles of precipitation for the 15
LONG TERM
CONDITIONS: 36-48 MONTHS
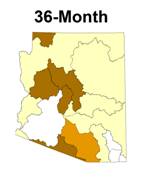
Although the 36-month
period remains the driest long-term period, with five central and southern
watersheds below the 12th percentile, four watersheds have moved
above the 40th percentile. Last
month nine watersheds were below the 25th percentile, and this month
only six are below the 25th percentile. Climate division 7 remains the hottest
36-month period on record, and the entire state is above the 76th
percentile for the 36-month temperature.
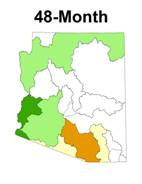
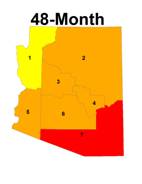
The 48-month period has
only six watersheds below the 50th percentile, while six are above
the 50th percentile, and three are above the 70th
percentile. The three driest watersheds
are in the southeast, although this wet monsoon has improved their condition
significantly. Temperatures for the
four-year period remain extremely high, with climate division 7 in the
southeast still the hottest 48-month period on record. All other climate divisions are above the 75th
percentile for temperature.
|
|
Precipitation Percentile |
Climate
Division |
Temperature Percentile |
|
Virgin |
8.82 |
CD1 |
76.58 |
|
|
28.57 |
CD2 |
87.39 |
|
Little |
31.43 |
CD3 |
87.39 |
|
Verde |
11.43 |
CD4 |
91.89 |
|
Bill
Williams |
5.71 |
CD5 |
89.19 |
|
|
8.57 |
CD6 |
94.59 |
|
|
45.71 |
CD7 |
100.00 |
|
Salt |
25.71 |
|
|
|
|
31.43 |
|
|
|
|
31.43 |
|
|
|
|
20.00 |
|
|
|
San Pedro |
40.00 |
|
|
|
Willcox
Playa |
48.57 |
|
|
|
San Simon |
8.57 |
|
|
|
White
Water Draw |
45.71 |
|
|
AUGUST 2006 – JULY 2008 (36-month): percentiles of temperature, and precipitation for the 15
|
Watershed |
Precipitation Percentile |
Climate
Division |
Temperature Percentile |
|
Virgin |
53.12 |
CD1 |
75.45 |
|
|
73.53 |
CD2 |
89.09 |
|
Little |
44.12 |
CD3 |
87.27 |
|
Verde |
55.88 |
CD4 |
94.55 |
|
Bill
Williams |
52.94 |
CD5 |
85.45 |
|
|
44.12 |
CD6 |
92.73 |
|
|
70.59 |
CD7 |
100.00 |
|
Salt |
44.12 |
|
|
|
|
76.47 |
|
|
|
|
50.00 |
|
|
|
|
17.65 |
|
|
|
San Pedro |
26.47 |
|
|
|
Willcox
Playa |
50.00 |
|
|
|
San Simon |
26.47 |
|
|
|
White
Water Draw |
50.00 |
|
|
AUGUST 2005 – JULY 2008 (48-month): percentiles of temperature, and precipitation for the 15
August 2008
The
following summary describes the heat and dryness across the state for the 1-,
3-, 6-, 12-, 24-, 36-, and 48-month periods.
SUMMARY
July: Although July is typically one of
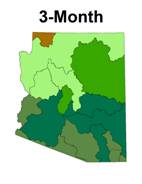
The 3-month period:
The monsoon activity also improved the
three-month period of May through July, especially for the southern half of the
state. The southern watersheds were all
above the 86th percentile, while the northern watersheds were
between the 63rd and 79th percentiles. The Virgin was the dry watershed, below the 6th
percentile. Three-month temperatures
were near or slightly above average in the eastern 2/3 of the state, and well
above average along the lower Colorado River and in Maricopa and
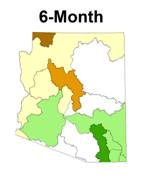
The 6-month period
precipitation, from February through July, was finally pushed above average in
the southeastern watersheds and the lower
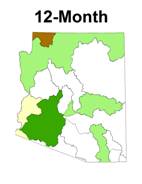
The 12-month period
precipitation is highly variable around the state, with near or above average
precipitation in all watersheds except the Virgin and lower
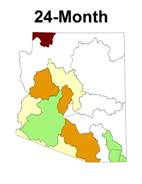
The 24-month period
now has only four watersheds at or below the 25th percentile, and
they are scattered across the state from the north to the south. Three watersheds in the southern half of the
state are above average, between the 66th and 73rd
percentile. The other eight watersheds
are near or slightly below average for the two-year period. Temperatures for the 24-month period are
essentially unchanged from last month’s update, with all climate divisions
above the 73rd percentile.
The 36-month period: Although the 36-month period remains the
driest long-term period, with five central and southern watersheds below the 12th
percentile, four watersheds have moved above the 40th
percentile. Last month nine watersheds
were below the 25th percentile, and this month only six are below
the 25th percentile. Climate
division 7 remains the hottest 36-month period on record, and the entire state
is above the 76th percentile for the 36-month temperature.
The 48-month period
has only six watersheds below the 50th percentile, while six are
above the 50th percentile, and three are above the 70th
percentile. The three driest watersheds
are in the southeast, although this wet monsoon has improved their condition
significantly. Temperatures for the
four-year period remain extremely high, with climate division 7 in the
southeast still the hottest 48-month period on record. All other climate divisions are above the 75th
percentile for temperature.