State Precipitation &
Temperature Update for
Conditions through August 2007
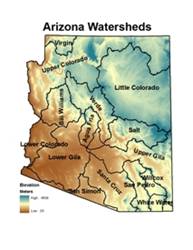
Precipitation
is monitored for the state of
Here, precipitation
percentile values for the most recent month, along with previous 3-, 6-, 12-,
24-, 36-, and 48-month total are shown for each watershed. Low percentile values (brown shading) indicate
dry conditions while high values (green shading) indicate wet conditions. For
example, a precipitation total that falls at the 100th percentile
means that it is the highest precipitation total for the 1971-present period.
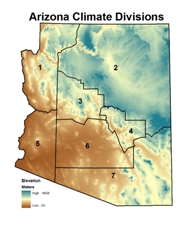 Temperature is monitored for the state of
Here, temperature
percentile values for the most recent month, along with previous 3-, 6-, 12-,
24-, 36-, and 48-month averages are shown for each climate division. Low percentile values (blue shading) indicate
cool conditions while high values (orange/red shading) indicate hot conditions.
For example, a temperature that falls at the 100th percentile means
that it is the highest average temperature for the 1895-present period.
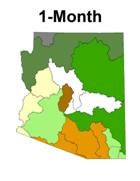
The maps of the seven
periods for precipitation and temperature are shown below, with tables of the
percentile values and descriptive text following the maps. Current update is 8/15/2007. San Pedro and
Precipitation Percentiles by Watershed
(through August 2007)
Temperature Percentiles by Climate
Division (through August 2007)
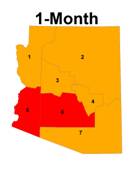

SHORT TERM CONDITIONS: 1-6 MONTHS
August, like July, is
generally a wet month across
|
Watershed |
Precipitation Percentile |
Climate
Division |
Temperature Percentile |
|
Virgin |
-99 |
CD1 |
92.92 |
|
|
89.19 |
CD2 |
91.15 |
|
Little |
78.38 |
CD3 |
92.92 |
|
Verde |
48.65 |
CD4 |
90.27 |
|
Bill
Williams |
35.14 |
CD5 |
98.23 |
|
|
13.51 |
CD6 |
97.35 |
|
|
64.86 |
CD7 |
89.38 |
|
Salt |
43.24 |
|
|
|
|
35.14 |
|
|
|
|
81.08 |
|
|
|
|
18.92 |
|
|
|
San Pedro |
21.62 |
|
|
|
Willcox
Playa |
62.16 |
|
|
|
San Simon |
16.22 |
|
|
|
White
Water Draw |
70.27 |
|
|
AUGUST 2007: percentiles of precipitation for the 15
|
Watershed |
Precipitation Percentile |
Climate
Division |
Temperature Percentile |
|
Virgin |
-99 |
CD1 |
95.58 |
|
|
91.89 |
CD2 |
94.69 |
|
Little |
86.49 |
CD3 |
94.69 |
|
Verde |
81.08 |
CD4 |
98.23 |
|
Bill
Williams |
67.57 |
CD5 |
90.27 |
|
|
56.76 |
CD6 |
98.23 |
|
|
94.59 |
CD7 |
93.81 |
|
Salt |
78.38 |
|
|
|
|
83.78 |
|
|
|
|
75.68 |
|
|
|
|
51.35 |
|
|
|
San Pedro |
59.46 |
|
|
|
Willcox
Playa |
62.16 |
|
|
|
San Simon |
59.46 |
|
|
|
White
Water Draw |
66.67 |
|
|
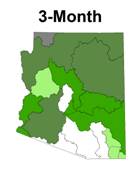
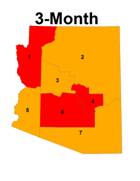
JUNE 2006 - AUGUST 2007 (3-month): percentiles of precipitation for the 15
|
Watershed |
Precipitation Percentile |
Climate
Division |
Temperature Percentile |
|
Virgin |
-99 |
CD1 |
92.92 |
|
|
81.08 |
CD2 |
96.46 |
|
Little |
64.86 |
CD3 |
96.46 |
|
Verde |
40.54 |
CD4 |
97.35 |
|
Bill
Williams |
37.84 |
CD5 |
95.58 |
|
|
40.54 |
CD6 |
99.12 |
|
|
89.19 |
CD7 |
98.23 |
|
Salt |
43.24 |
|
|
|
|
67.57 |
|
|
|
|
78.38 |
|
|
|
|
35.14 |
|
|
|
San Pedro |
51.35 |
|
|
|
Willcox
Playa |
72.97 |
|
|
|
San Simon |
48.65 |
|
|
|
White
Water Draw |
69.44 |
|
|
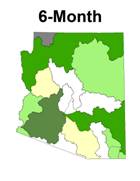
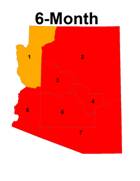
MARCH 2006 – AUGUST 2007 (6-month): percentiles of precipitation for the 15
INTERMEDIATE
TERM CONDITIONS: 12-24 MONTHS
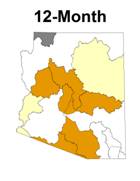
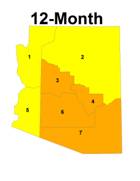
The 12-month period combines
the dry winter of 2006-07 with the slightly above-average summer monsoon of
2007. The southeast, eastern, and lower
Gila watersheds were very near average, while the rest of the state had a very
dry year. Even though conditions were
much warmer than average, only two climate divisions were above the 90th
percentile. The very cold weather that
came through the state in late December and early January helped to bring the
average temperatures down for the year, somewhat balancing out the warmer than
average summer.
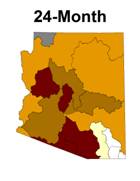
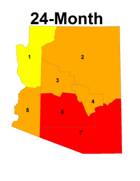
For the two-year
period, we continue to see the cycle of an extremely dry year occurring at least
every two years. One year ago, the
12-month period had almost every watershed below the 15th
percentile. Now that dry year has moved
into the two-year period, and it continues to show the driest conditions of all
periods, as it did last month. Only the
far southeastern corner of the state has had near normal precipitation during
the two-year period. That is mostly due
to two consecutive wet monsoons in that area, as monsoonal moisture was drawn toward
Watershed |
Precipitation Percentile |
Climate
Division |
Temperature Percentile |
|
Virgin |
-99 |
CD1 |
83.04 |
|
|
50.00 |
CD2 |
82.14 |
|
Little |
33.33 |
CD3 |
87.50 |
|
Verde |
25.00 |
CD4 |
90.18 |
|
Bill
Williams |
25.00 |
CD5 |
83.93 |
|
|
22.22 |
CD6 |
89.29 |
|
|
44.44 |
CD7 |
93.75 |
|
Salt |
25.00 |
|
|
|
|
38.89 |
|
|
|
|
55.56 |
|
|
|
|
19.44 |
|
|
|
San Pedro |
41.67 |
|
|
|
Willcox
Playa |
57.14 |
|
|
|
San Simon |
16.67 |
|
|
|
White
Water Draw |
55.56 |
|
|
SEPTEMBER 2006 – AUGUST 2007
(12-month): percentiles of precipitation for
the 15
|
Watershed |
Precipitation Percentile |
Climate
Division |
Temperature Percentile |
|
Virgin |
-99 |
CD1 |
82.88 |
|
|
22.86 |
CD2 |
93.69 |
|
Little |
20.00 |
CD3 |
91.89 |
|
Verde |
11.43 |
CD4 |
93.69 |
|
Bill
Williams |
2.86 |
CD5 |
90.09 |
|
|
2.86 |
CD6 |
97.30 |
|
|
14.29 |
CD7 |
100.00 |
|
Salt |
5.71 |
|
|
|
|
20.00 |
|
|
|
|
22.86 |
|
|
|
|
2.86 |
|
|
|
San Pedro |
25.71 |
|
|
|
Willcox
Playa |
51.43 |
|
|
|
San Simon |
2.86 |
|
|
|
White
Water Draw |
45.71 |
|
|
SEPTEMBER 2005 – AUGUST 2007
(24-month): percentiles of precipitation for
the 15
LONG TERM
CONDITIONS: 36-48 MONTHS
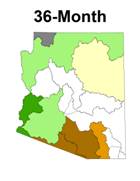
The 36-month precipitation
period shows the results of the wet winter of 2004-05 in northern and western
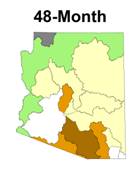
The 48-month period
precipitation is above average across the northern part of the state, and well
below average in south central
Watershed |
Precipitation Percentile |
Climate
Division |
Temperature Percentile |
|
Virgin |
-99 |
CD1 |
75.45 |
|
|
70.59 |
CD2 |
90.91 |
|
Little |
38.24 |
CD3 |
88.18 |
|
Verde |
55.88 |
CD4 |
94.55 |
|
Bill
Williams |
50.00 |
CD5 |
85.45 |
|
|
47.06 |
CD6 |
95.45 |
|
|
64.71 |
CD7 |
100.00 |
|
Salt |
44.12 |
|
|
|
|
82.35 |
|
|
|
|
52.94 |
|
|
|
|
11.76 |
|
|
|
San Pedro |
23.53 |
|
|
|
Willcox
Playa |
44.12 |
|
|
|
San Simon |
14.71 |
|
|
|
White
Water Draw |
55.88 |
|
|
SEPTEMBER 2004 – AUGUST 2007
(36-month): percentiles of temperature, and
precipitation for the 15
|
Watershed |
Precipitation Percentile |
Climate
Division |
Temperature Percentile |
|
Virgin |
-99 |
CD1 |
78.90 |
|
|
69.70 |
CD2 |
89.91 |
|
Little |
30.30 |
CD3 |
93.58 |
|
Verde |
39.39 |
CD4 |
95.41 |
|
Bill
Williams |
27.27 |
CD5 |
88.99 |
|
|
21.21 |
CD6 |
99.08 |
|
|
48.48 |
CD7 |
100.00 |
|
Salt |
27.27 |
|
|
|
|
72.73 |
|
|
|
|
36.36 |
|
|
|
|
6.06 |
|
|
|
San Pedro |
24.24 |
|
|
|
Willcox
Playa |
39.39 |
|
|
|
San Simon |
18.18 |
|
|
|
White
Water Draw |
48.48 |
|
|
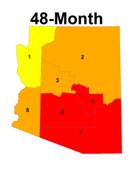
SEPTEMBER 2003 – AUGUST 2007
(48-month): percentiles of temperature, and precipitation for the 15
September 2007
The
following summary describes the heat and dryness across the state for the 1-,
3-, 6-, 12-, 24-, 36-, and 48-month periods.
SUMMARY
August,
like July, is generally a wet month across
Three-month period
– of June through August, was well above average for 11 watersheds and near
average for three watersheds, due to the wet July. The big winners of rainfall were the northern
watersheds on the
Six-month period
–was slightly above the average rainfall in the north, along the lower
Twelve-month period
– combines the dry winter of 2006-07 with the slightly above-average summer
monsoon of 2007. The southeast, eastern,
and lower Gila watersheds were very near average, while the rest of the state
had a very dry year. While conditions
were much warmer than average, only two climate divisions were above the 90th
percentile. The very cold weather that
came through the state in late December and early January helped to bring the
average temperatures down for the year, somewhat balancing out the warmer than
average summer.
Two-year period
- continues to show the cycle of an extremely dry year occurring at least every
two years. One year ago, the 12-month
period had almost every watershed below the 15th percentile. Now that dry year has moved into the two-year
period, and it continues to show the driest conditions of all periods, as it did
last month. Only the far southeastern
corner of the state has had near normal precipitation during the two-year
period. That is mostly due to two
consecutive wet monsoons in that area, as monsoonal moisture was drawn toward
Three-year period
- The 36-month precipitation period shows the results of the wet winter of
2004-05 in northern and western
Four-year period
- The 48-month period precipitation is above average across the northern part
of the state, and well below average in south central