State Precipitation &
Temperature Update for
Conditions through September 2008
Precipitation
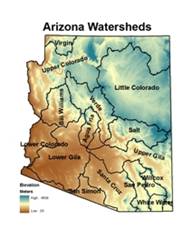
is monitored for the state of
Here, precipitation
percentile values for the most recent month, along with previous 3-, 6-, 12-,
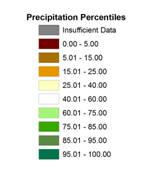
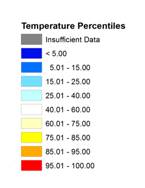
24-, 36-, and 48-month total are shown for each watershed. Low percentile values (brown shading) indicate
dry conditions while high values (green shading) indicate wet conditions. For
example, a precipitation total that falls at the 100th percentile
means that it is the highest precipitation total for the 1971-present period.
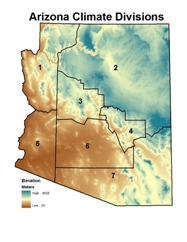 Temperature is monitored for the state of
Here, temperature
percentile values for the most recent month, along with previous 3-, 6-, 12-,
24-, 36-, and 48-month averages are shown for each climate division. Low percentile values (blue shading) indicate
cool conditions while high values (orange/red shading) indicate hot conditions.
For example, a temperature that falls at the 100th percentile means
that it is the highest average temperature for the 1895-present period.
The maps of the seven
periods for precipitation and temperature are shown below, with tables of the
percentile values and descriptive text following the maps. Current update is 10/20/2008. The data are preliminary.
Precipitation Percentiles by Watershed
(through September 2008)
Temperature Percentiles by Climate
Division (through September 2008)
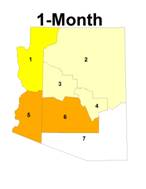
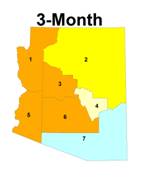
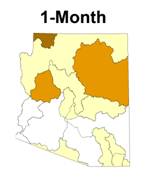
SHORT TERM CONDITIONS: 1-6 MONTHS
September was much
drier than average across northern and southeastern
|
Watershed |
Precipitation Percentile |
Climate
Division |
Temperature Percentile |
|
Virgin |
8.33 |
CD1 |
82.89 |
|
|
28.95 |
CD2 |
68.42 |
|
Little |
18.42 |
CD3 |
70.18 |
|
Verde |
26.32 |
CD4 |
64.04 |
|
Bill
Williams |
21.05 |
CD5 |
87.72 |
|
|
31.58 |
CD6 |
92.98 |
|
|
52.63 |
CD7 |
59.65 |
|
Salt |
28.95 |
|
|
|
|
42.11 |
|
|
|
|
52.63 |
|
|
|
|
42.11 |
|
|
|
San Pedro |
31.58 |
|
|
|
Willcox
Playa |
28.95 |
|
|
|
San Simon |
39.47 |
|
|
|
White
Water Draw |
36.84 |
|
|
SEPTEMBER 2008: percentiles of precipitation for the 15
|
Watershed |
Precipitation Percentile |
Climate
Division |
Temperature Percentile |
|
Virgin |
13.89 |
CD1 |
90.27 |
|
|
68.42 |
CD2 |
81.58 |
|
Little |
39.47 |
CD3 |
85.96 |
|
Verde |
60.53 |
CD4 |
69.30 |
|
Bill
Williams |
57.89 |
CD5 |
92.98 |
|
|
50.00 |
CD6 |
90.35 |
|
|
94.74 |
CD7 |
38.60 |
|
Salt |
89.47 |
|
|
|
|
57.89 |
|
|
|
|
97.37 |
|
|
|
|
84.21 |
|
|
|
San Pedro |
92.11 |
|
|
|
Willcox
Playa |
86.84 |
|
|
|
San Simon |
89.47 |
|
|
|
White
Water Draw |
75.68 |
|
|
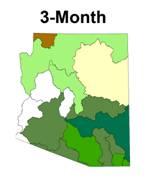
JULY 2008 - SEPTEMBER 2008 (3-month): percentiles of precipitation for the 15
|
Watershed |
Precipitation Percentile |
Climate
Division |
Temperature Percentile |
|
Virgin |
2.78 |
CD1 |
73.45 |
|
|
55.26 |
CD2 |
68.42 |
|
Little |
36.84 |
CD3 |
78.95 |
|
Verde |
42.11 |
CD4 |
48.25 |
|
Bill
Williams |
52.63 |
CD5 |
88.60 |
|
|
47.37 |
CD6 |
90.35 |
|
|
94.74 |
CD7 |
65.79 |
|
Salt |
81.58 |
|
|
|
|
56.58 |
|
|
|
|
92.11 |
|
|
|
|
78.95 |
|
|
|
San Pedro |
94.74 |
|
|
|
Willcox
Playa |
73.68 |
|
|
|
San Simon |
89.47 |
|
|
|
White
Water Draw |
62.16 |
|
|
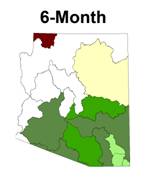
APRIL 2008 – SEPTEMBER 2008
(6-month): percentiles of precipitation for
the 15
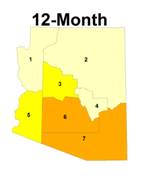
INTERMEDIATE
TERM CONDITIONS: 12-24 MONTHS
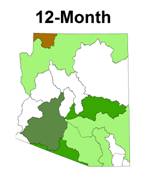
The 12-month period precipitation
was near or above average everywhere except the
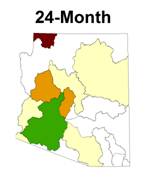
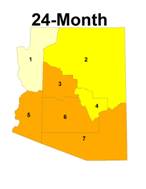
The 24-month period had
one watershed (lower Gila) with above average precipitation, seven watersheds
near average, and seven watersheds below average. Temperatures for the 24-month period continue
to be above the 75th percentile across the state, and above the 85th
percentile in the southern half of
Watershed |
Precipitation Percentile |
Climate
Division |
Temperature Percentile |
|
Virgin |
11.43 |
CD1 |
72.57 |
|
|
62.16 |
CD2 |
63.72 |
|
Little |
43.24 |
CD3 |
78.76 |
|
Verde |
51.35 |
CD4 |
73.01 |
|
Bill
Williams |
40.54 |
CD5 |
79.65 |
|
|
48.65 |
CD6 |
86.28 |
|
|
86.49 |
CD7 |
85.84 |
|
Salt |
75.68 |
|
|
|
|
45.95 |
|
|
|
|
72.97 |
|
|
|
|
62.16 |
|
|
|
San Pedro |
64.86 |
|
|
|
Willcox
Playa |
50.00 |
|
|
|
San Simon |
83.78 |
|
|
|
White
Water Draw |
48.65 |
|
|
OCTOBER 2008 – SEPTEMBER 2008
(12-month): percentiles of precipitation for
the 15
|
Watershed |
Precipitation Percentile |
Climate
Division |
Temperature Percentile |
|
Virgin |
3.03 |
CD1 |
75.00 |
|
|
55.56 |
CD2 |
83.93 |
|
Little |
33.33 |
CD3 |
86.61 |
|
Verde |
27.78 |
CD4 |
83.04 |
|
Bill
Williams |
19.44 |
CD5 |
89.29 |
|
|
19.44 |
CD6 |
94.64 |
|
|
77.78 |
CD7 |
94.64 |
|
Salt |
52.78 |
|
|
|
|
36.11 |
|
|
|
|
58.33 |
|
|
|
|
27.78 |
|
|
|
San Pedro |
41.67 |
|
|
|
Willcox
Playa |
44.44 |
|
|
|
San Simon |
52.78 |
|
|
|
White
Water Draw |
47.22 |
|
|
OCTOBER 2007 – SEPTEMBER 2008
(24-month): percentiles of precipitation for
the 15
LONG TERM
CONDITIONS: 36-48 MONTHS
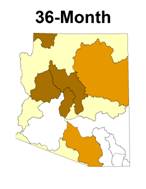
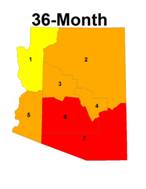
The 36-month period is
still the driest period statewide, with the southeast watersheds near average,
and the northern half of the state well below average for precipitation. Ten watersheds are below the 40th percentile,
and six are below the 25th percentile. Temperatures for the three year period were very
warm, with six of the seven climate divisions above the 87th
percentile. The southeast climate
division continues to be the warmest in 112 years.
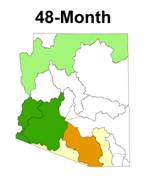
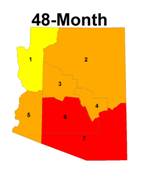
The 48-month period has
nine watersheds with near average, three watersheds (San Simon,
|
|
Precipitation Percentile |
Climate
Division |
Temperature Percentile |
|
Virgin |
6.06 |
CD1 |
78.38 |
|
|
28.57 |
CD2 |
87.84 |
|
Little |
20.00 |
CD3 |
89.19 |
|
Verde |
11.43 |
CD4 |
92.79 |
|
Bill
Williams |
8.57 |
CD5 |
90.99 |
|
|
8.57 |
CD6 |
98.20 |
|
|
57.14 |
CD7 |
100.00 |
|
Salt |
28.57 |
|
|
|
|
25.71 |
|
|
|
|
45.71 |
|
|
|
|
20.00 |
|
|
|
San Pedro |
42.86 |
|
|
|
Willcox
Playa |
51.43 |
|
|
|
San Simon |
28.57 |
|
|
|
White
Water Draw |
45.71 |
|
|
OCTOBER 2006 – SEPTEMBER 2008
(36-month): percentiles of temperature, and
precipitation for the 15
|
Watershed |
Precipitation Percentile |
Climate
Division |
Temperature Percentile |
|
Virgin |
58.06 |
CD1 |
75.45 |
|
|
73.53 |
CD2 |
89.09 |
|
Little |
44.12 |
CD3 |
88.18 |
|
Verde |
55.88 |
CD4 |
93.64 |
|
Bill
Williams |
47.06 |
CD5 |
85.45 |
|
|
44.12 |
CD6 |
97.27 |
|
|
79.41 |
CD7 |
100.00 |
|
Salt |
50.00 |
|
|
|
|
82.35 |
|
|
|
|
47.06 |
|
|
|
|
23.53 |
|
|
|
San Pedro |
38.24 |
|
|
|
Willcox
Playa |
44.12 |
|
|
|
San Simon |
32.35 |
|
|
|
White
Water Draw |
50.00 |
|
|
OCTOBER 2005 – SEPTEMBER 2008
(48-month): percentiles of temperature, and
precipitation for the 15
October 2008
The
following summary describes the heat and dryness across the state for the 1-,
3-, 6-, 12-, 24-, 36-, and 48-month periods.
SUMMARY
September
was much drier than average across northern and southeastern
The 3-month period
shows how wet the monsoon season was, with the southern half of the state above
the 75th percentile. The Little
Colorado watershed was drier than average for the monsoon season, and the lower
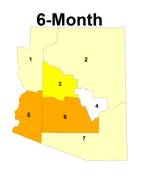
The 6-month period
precipitation, from April through September, was also well above average in the
southern half of the state and near or below average in the northern half of
the state. Six month temperatures were
only slightly above average across most of the state, but above the 88th
percentile in Maricopa, Pinal,
The 12-month period
precipitation was near or above average everywhere except the
The 24-month period
had one watershed (lower Gila) with above average precipitation, seven
watersheds near average, and seven watersheds below average. Temperatures for the 24-month period continue
to be above the 75th percentile across the state, and above the 85th
percentile in the southern half of
The 36-month period
is still the driest period statewide, with the southeast watersheds near
average, and the northern half of the state well below average for
precipitation. Ten watersheds are below
the 40th percentile, and six are below the 25th
percentile. Temperatures for the three
year period were very warm, with six of the seven climate divisions above the
87th percentile. The
southeast climate division continues to be the warmest in 112 years.
The 48-month period
has nine watersheds with near average, three watersheds (San Simon,