State Precipitation &
Temperature Update for
Conditions through October
2006
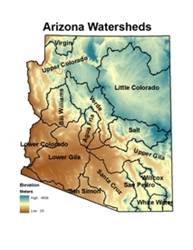
Precipitation
is monitored for the state of
Here, precipitation
percentile values for the most recent month, along with previous 3-, 6-, 12-,
24-, 36-, and 48-month total are shown for each watershed. Low percentile values (brown shading) indicate
dry conditions while high values (green shading) indicate wet conditions. For
example, a precipitation total that falls at the 100th percentile
means that it is the highest precipitation total for the 1971-present period.
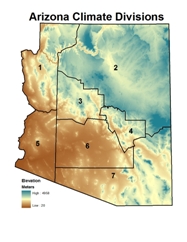 Temperature is monitored for the state of
Here, temperature
percentile values for the most recent month, along with previous 3-, 6-, 12-,
24-, 36-, and 48-month averages are shown for each climate division. Low percentile values (blue shading) indicate
cool conditions while high values (orange/red shading) indicate hot conditions.
For example, a temperature that falls at the 100th percentile means
that it is the highest average temperature for the 1895-present period.
The maps of the seven
periods for precipitation and temperature are shown below, with tables of the
percentile values and descriptive text following the maps. Current update is 12/10/2006. Note the San Pedro and
Precipitation Percentiles by Watershed
(through October 2006)
Temperature Percentiles by Climate
Division (through October 2006)
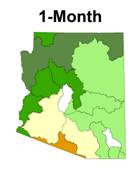
SHORT TERM CONDITIONS: 1-6 MONTHS
October brought
above-average rainfall to northwest
|
Watershed |
Precipitation Percentile |
Climate
Division |
Temperature Percentile |
|
Virgin |
77.78 |
CD1 |
54.46 |
|
|
91.67 |
CD2 |
34.82 |
|
Little |
75.00 |
CD3 |
33.93 |
|
Verde |
77.78 |
CD4 |
38.39 |
|
Bill
Williams |
77.78 |
CD5 |
56.25 |
|
|
59.72 |
CD6 |
73.21 |
|
|
38.89 |
CD7 |
49.11 |
|
Salt |
72.22 |
|
|
|
|
77.78 |
|
|
|
|
63.89 |
|
|
|
|
33.33 |
|
|
|
San Pedro |
69.44 |
|
|
|
Willcox
Playa |
55.56 |
|
|
|
San Simon |
16.67 |
|
|
|
White
Water Draw |
63.89 |
|
|
OCTOBER 2006: percentiles of precipitation for the 15
|
Watershed |
Precipitation Percentile |
Climate
Division |
Temperature Percentile |
|
Virgin |
52.94 |
CD1 |
68.30 |
|
|
75.00 |
CD2 |
16.07 |
|
Little |
61.11 |
CD3 |
32.59 |
|
Verde |
61.11 |
CD4 |
23.21 |
|
Bill
Williams |
41.67 |
CD5 |
73.21 |
|
|
77.78 |
CD6 |
67.86 |
|
|
66.67 |
CD7 |
25.00 |
|
Salt |
75.00 |
|
|
|
|
69.44 |
|
|
|
|
77.78 |
|
|
|
|
50.00 |
|
|
|
San Pedro |
75.00 |
|
|
|
Willcox
Playa |
86.11 |
|
|
|
San Simon |
50.00 |
|
|
|
White
Water Draw |
83.33 |
|
|
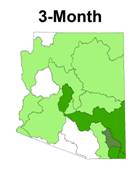
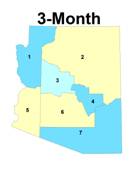
AUGUST 2006 - OCTOBER 2006 (3-month): percentiles of precipitation for the 15
|
Watershed |
Precipitation Percentile |
Climate
Division |
Temperature Percentile |
|
Virgin |
45.59 |
CD1 |
83.04 |
|
|
63.89 |
CD2 |
83.48 |
|
Little |
72.22 |
CD3 |
91.96 |
|
Verde |
61.11 |
CD4 |
79.46 |
|
Bill
Williams |
33.33 |
CD5 |
97.32 |
|
|
58.33 |
CD6 |
97.32 |
|
|
61.11 |
CD7 |
98.21 |
|
Salt |
69.44 |
|
|
|
|
69.44 |
|
|
|
|
83.33 |
|
|
|
|
77.78 |
|
|
|
San Pedro |
94.44 |
|
|
|
Willcox
Playa |
100.00 |
|
|
|
San Simon |
61.11 |
|
|
|
White
Water Draw |
80.00 |
|
|
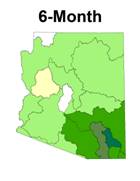
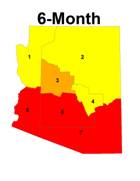
MAY 2005 – OCTOBER 2006 (6-month): percentiles of precipitation for the 15
INTERMEDIATE
TERM CONDITIONS: 12-24 MONTHS
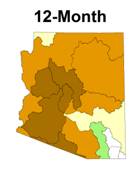
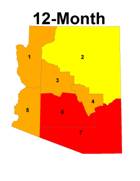
The 12-month period is
the most graphic indicator of the exceptionally dry winter of 2005, where most
of the state had precipitation below the 25th percentile, and many
watersheds in the west central part of the state were below the 15th
percentile. The southeast fared only
slightly better, with the San Pedro and Willcox as the only watersheds above
the 50th percentile, mostly as a result of a very wet monsoon. The corresponding temperatures for the 1-year
period remain extremely high, above the 85th percentile everywhere
except the Colorado Plateau, which is above the 75th percentile. The southeast and south central areas were
above the 95th percentile.
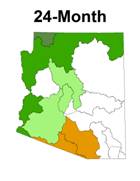
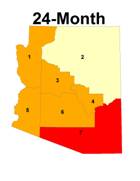
In contrast, the
2-year period shows the
Watershed |
Precipitation Percentile |
Climate
Division |
Temperature Percentile |
|
Virgin |
27.27 |
CD1 |
75.68 |
|
|
20.00 |
CD2 |
89.19 |
|
Little |
20.00 |
CD3 |
89.19 |
|
Verde |
14.29 |
CD4 |
92.79 |
|
Bill
Williams |
8.57 |
CD5 |
91.89 |
|
|
14.29 |
CD6 |
95.50 |
|
|
14.29 |
CD7 |
99.10 |
|
Salt |
17.14 |
|
|
|
|
22.86 |
|
|
|
|
34.29 |
|
|
|
|
17.14 |
|
|
|
San Pedro |
62.86 |
|
|
|
Willcox
Playa |
58.82 |
|
|
|
San Simon |
11.43 |
|
|
|
White
Water Draw |
48.57 |
|
|
OCTOBER 2005 – OCTOBER 2006
(12-month): percentiles of precipitation for
the 15
|
Watershed |
Precipitation Percentile |
Climate
Division |
Temperature Percentile |
|
Virgin |
90.32 |
CD1 |
72.73 |
|
|
79.41 |
CD2 |
90.91 |
|
Little |
52.94 |
CD3 |
90.00 |
|
Verde |
64.71 |
CD4 |
91.82 |
|
Bill
Williams |
58.82 |
CD5 |
88.18 |
|
|
64.71 |
CD6 |
92.73 |
|
|
67.65 |
CD7 |
99.09 |
|
Salt |
55.88 |
|
|
|
|
82.35 |
|
|
|
|
58.82 |
|
|
|
|
20.59 |
|
|
|
San Pedro |
47.06 |
|
|
|
Willcox
Playa |
58.82 |
|
|
|
San Simon |
20.59 |
|
|
|
White
Water Draw |
55.88 |
|
|
OCTOBER 2004 – OCTOBER 2006
(24-month): percentiles of precipitation for
the 15
LONG TERM
CONDITIONS: 36-48 MONTHS
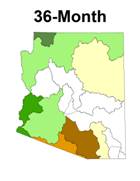
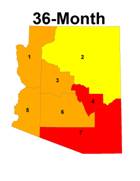
The 36-month precipitation
rankings have changed little since the October update, with the western half of
the state remaining near or above-average, while the eastern half of the state
is near or below-average, with the
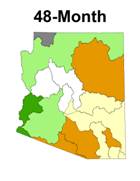
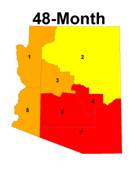
The 48-month
precipitation shows slight improvement, particularly in the southern half of
the state. The western watersheds are near or above-normal while the eastern
watersheds are near or below-normal. The
driest are the Little Colorado,
Watershed |
Precipitation Percentile |
Climate
Division |
Temperature Percentile |
|
Virgin |
93.55 |
CD1 |
76.15 |
|
|
69.70 |
CD2 |
89.91 |
|
Little |
36.36 |
CD3 |
88.99 |
|
Verde |
54.55 |
CD4 |
95.41 |
|
Bill
Williams |
57.58 |
CD5 |
88.07 |
|
|
45.45 |
CD6 |
93.58 |
|
|
60.61 |
CD7 |
99.08 |
|
Salt |
48.48 |
|
|
|
|
84.85 |
|
|
|
|
54.55 |
|
|
|
|
12.12 |
|
|
|
San Pedro |
36.36 |
|
|
|
Willcox
Playa |
51.52 |
|
|
|
San Simon |
18.18 |
|
|
|
White
Water Draw |
51.52 |
|
|
OCTOBER 2003 – OCTOBER 2006
(36-month): percentiles of temperature, and
precipitation for the 15
|
Watershed |
Precipitation Percentile |
Climate
Division |
Temperature Percentile |
|
Virgin |
-99.99 |
CD1 |
78.70 |
|
|
68.75 |
CD2 |
90.74 |
|
Little |
21.88 |
CD3 |
94.44 |
|
Verde |
56.25 |
CD4 |
97.22 |
|
Bill
Williams |
56.25 |
CD5 |
92.59 |
|
|
40.62 |
CD6 |
97.22 |
|
|
62.50 |
CD7 |
100.00 |
|
Salt |
37.50 |
|
|
|
|
81.25 |
|
|
|
|
28.12 |
|
|
|
|
15.62 |
|
|
|
San Pedro |
28.12 |
|
|
|
Willcox
Playa |
18.75 |
|
|
|
San Simon |
25.00 |
|
|
|
White
Water Draw |
28.12 |
|
|
OCTOBER 2002 – OCTOBER 2006
(48-month): percentiles of temperature, and
precipitation for the 15
October 2006
The
following summary describes the heat and dryness across the state for the 1-,
3-, 6-, 12-, 24-, 36-, and 48-month periods. The Virgin River
watershed has not yet reported precipitation data, and the
SUMMARY
October brought above-average rainfall to northwest
Three-month period – Precipitation was above average
everywhere in the state except the Virgin, Bill Williams,
Six-month period – is still well above average for the
southeast watershed, and above average for the rest of the state, except Bill
Williams at the 33rd percentile.
Temperatures were above the 75th percentile everywhere in the
state for the summer and above the 95th percentile across the
southern half of the state. The extreme
temperatures generated an increased demand for the summer precipitation.
Twelve-month period -
is the most graphic indicator of the exceptionally dry winter of 2005, where
most of the state had precipitation below the 25th percentile, and
many watersheds in the west central part of the state were below the 15th
percentile. The southeast fared only
slightly better, with the San Pedro and Willcox as the only watersheds above
the 50th percentile, mostly as a result of a very wet monsoon. The corresponding temperatures for the 1-year
period remain extremely high, above the 85th percentile everywhere
except the Colorado Plateau, which is above the 75th percentile. The southeast and south central areas were
above the 95th percentile.
Two-year period - shows
the
Three-year period - has
changed little since the October update, with the western half of the state
remaining near or above-average, while the eastern half of the state is near or
below-average, with the Santa Cruz and San Simon watersheds continuing to be
the driest. There is no change in the
36-month temperatures, with the entire state still above the 75th
percentile. Climate divisions 4 and 7 in
the southeast remain above the 95th percentile for temperature.
Four-year period - shows
slight improvement, particularly in the southern half of the state. The western
watersheds are near or above-normal while the eastern watersheds are near or
below-normal. The driest are the Little
Colorado,