State Precipitation &
Temperature Update for
Conditions through October 2007
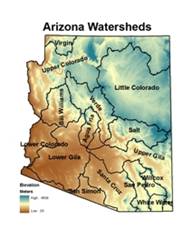
Precipitation
is monitored for the state of
Here, precipitation
percentile values for the most recent month, along with previous 3-, 6-, 12-,
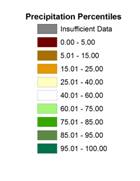
24-, 36-, and 48-month total are shown for each watershed. Low percentile values (brown shading) indicate
dry conditions while high values (green shading) indicate wet conditions. For
example, a precipitation total that falls at the 100th percentile
means that it is the highest precipitation total for the 1971-present period.
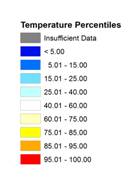
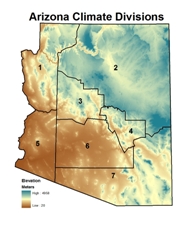 Temperature is monitored for the state of
Here, temperature
percentile values for the most recent month, along with previous 3-, 6-, 12-,
24-, 36-, and 48-month averages are shown for each climate division. Low percentile values (blue shading) indicate
cool conditions while high values (orange/red shading) indicate hot conditions.
For example, a temperature that falls at the 100th percentile means
that it is the highest average temperature for the 1895-present period.
The maps of the seven
periods for precipitation and temperature are shown below, with tables of the
percentile values and descriptive text following the maps. Current update is 12/02/2007. The data are preliminary.
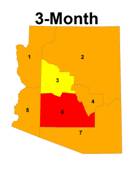
Precipitation Percentiles by Watershed (through
October 2007)
Temperature Percentiles by Climate
Division (through October 2007)
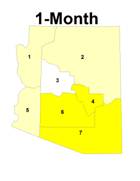

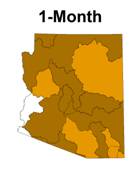
SHORT TERM CONDITIONS: 1-6 MONTHS
October was extremely
dry, with all watersheds, except the lower
|
Watershed |
Precipitation Percentile |
Climate
Division |
Temperature Percentile |
|
Virgin |
5.41 |
CD1 |
65.93 |
|
|
10.81 |
CD2 |
69.47 |
|
Little |
16.22 |
CD3 |
56.64 |
|
Verde |
10.81 |
CD4 |
84.51 |
|
Bill
Williams |
21.62 |
CD5 |
61.95 |
|
|
10.81 |
CD6 |
82.30 |
|
|
13.51 |
CD7 |
76.99 |
|
Salt |
13.51 |
|
|
|
|
45.95 |
|
|
|
|
10.81 |
|
|
|
|
16.22 |
|
|
|
San Pedro |
13.51 |
|
|
|
Willcox
Playa |
18.92 |
|
|
|
San Simon |
13.51 |
|
|
|
White
Water Draw |
16.22 |
|
|
OCTOBER 2007: percentiles of precipitation for the 15
|
Watershed |
Precipitation Percentile |
Climate
Division |
Temperature Percentile |
|
Virgin |
2.86 |
CD1 |
87.17 |
|
|
48.65 |
CD2 |
85.84 |
|
Little |
32.43 |
CD3 |
81.86 |
|
Verde |
32.43 |
CD4 |
93.81 |
|
Bill Williams |
21.62 |
CD5 |
85.40 |
|
|
8.11 |
CD6 |
95.58 |
|
|
35.14 |
CD7 |
87.61 |
|
Salt |
18.92 |
|
|
|
|
18.92 |
|
|
|
|
32.43 |
|
|
|
|
16.22 |
|
|
|
San Pedro |
21.62 |
|
|
|
Willcox
Playa |
43.24 |
|
|
|
San Simon |
8.11 |
|
|
|
White
Water Draw |
43.24 |
|
|
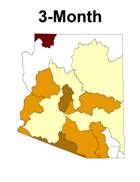
AUGUST 2006 - OCTOBER 2007 (3-month): percentiles of precipitation for the 15
|
Watershed |
Precipitation Percentile |
Climate
Division |
Temperature Percentile |
|
Virgin |
2.86 |
CD1 |
92.04 |
|
|
59.46 |
CD2 |
92.92 |
|
Little |
51.35 |
CD3 |
95.58 |
|
Verde |
56.76 |
CD4 |
97.35 |
|
Bill
Williams |
56.76 |
CD5 |
93.81 |
|
|
32.43 |
CD6 |
97.35 |
|
|
78.38 |
CD7 |
95.58 |
|
Salt |
51.35 |
|
|
|
|
59.46 |
|
|
|
|
43.24 |
|
|
|
|
37.84 |
|
|
|
San Pedro |
37.84 |
|
|
|
Willcox
Playa |
48.65 |
|
|
|
San Simon |
32.43 |
|
|
|
White
Water Draw |
47.22 |
|
|
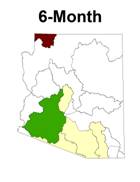
MAY 2006 – OCTOBER 2007 (6-month): percentiles of precipitation for the 15
INTERMEDIATE
TERM CONDITIONS: 12-24 MONTHS
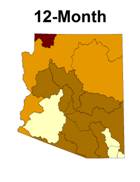
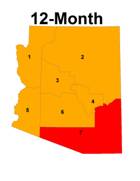
The 12-month period has
been extremely dry in most of the state.
Three watersheds in the southern part of the state were between the 8th
and 14th percentile, and the other 12 watersheds were all below the
23rd percentile, putting this year on the dry side of the drought tally. The entire state continued to have
temperatures above the 85th percentile during the previous 12
months. Many locations had daily records
tied or broken for both maximum and minimum temperatures.
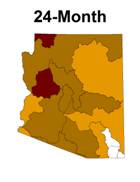
The two year period
continues to show the driest conditions of all periods. The last wet year was 2005, with high
precipitation totals for both winter and summer in most places. Since then, we have had two very dry years,
punctuated with an occasional wet month, usually in summer. The Virgin, Bill Williams, Agua Fria, Salt,
Watershed |
Precipitation Percentile |
Climate
Division |
Temperature Percentile |
|
Virgin |
2.94 |
CD1 |
87.50 |
|
|
22.22 |
CD2 |
91.07 |
|
Little |
16.67 |
CD3 |
93.75 |
|
Verde |
11.11 |
CD4 |
94.64 |
|
Bill
Williams |
11.11 |
CD5 |
88.39 |
|
|
5.56 |
CD6 |
94.64 |
|
|
33.33 |
CD7 |
95.54 |
|
Salt |
5.56 |
|
|
|
|
19.44 |
|
|
|
|
13.89 |
|
|
|
|
8.33 |
|
|
|
San Pedro |
11.11 |
|
|
|
Willcox
Playa |
28.57 |
|
|
|
San Simon |
8.33 |
|
|
|
White
Water Draw |
38.89 |
|
|
NOVEMBER 2006 – OCTOBER 2007
(12-month): percentiles of precipitation for
the 15
|
Watershed |
Precipitation Percentile |
Climate
Division |
Temperature Percentile |
|
Virgin |
3.12 |
CD1 |
81.08 |
|
|
11.43 |
CD2 |
92.79 |
|
Little |
17.14 |
CD3 |
91.89 |
|
Verde |
11.43 |
CD4 |
93.69 |
|
Bill
Williams |
2.86 |
CD5 |
91.89 |
|
|
5.71 |
CD6 |
96.40 |
|
|
11.43 |
CD7 |
100.00 |
|
Salt |
8.57 |
|
|
|
|
17.14 |
|
|
|
|
17.14 |
|
|
|
|
5.71 |
|
|
|
San Pedro |
22.86 |
|
|
|
Willcox
Playa |
45.71 |
|
|
|
San Simon |
5.71 |
|
|
|
White
Water Draw |
42.86 |
|
|
NOVEMBER 2005 – OCTOBER 2007
(24-month): percentiles of precipitation for
the 15
LONG TERM
CONDITIONS: 36-48 MONTHS
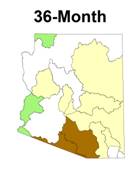
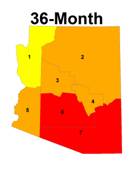
The 36-month precipitation
period continues to show the results of the wet winter of 2004-05 in northern
and western
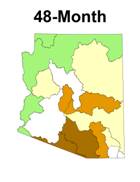
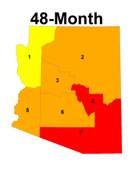
The 48-month period
precipitation is also above average across the northern part of the state, and
well below average in south central
Watershed |
Precipitation Percentile |
Climate
Division |
Temperature Percentile |
|
Virgin |
62.50 |
CD1 |
77.27 |
|
|
58.82 |
CD2 |
91.82 |
|
Little |
35.29 |
CD3 |
90.00 |
|
Verde |
44.12 |
CD4 |
94.55 |
|
Bill
Williams |
32.35 |
CD5 |
88.18 |
|
|
38.24 |
CD6 |
98.18 |
|
|
52.94 |
CD7 |
100.00 |
|
Salt |
35.29 |
|
|
|
|
64.71 |
|
|
|
|
29.41 |
|
|
|
|
8.82 |
|
|
|
San Pedro |
29.41 |
|
|
|
Willcox
Playa |
38.24 |
|
|
|
San Simon |
8.82 |
|
|
|
White
Water Draw |
47.06 |
|
|
NOVEMBER 2004 – OCTOBER 2007
(36-month): percentiles of temperature, and
precipitation for the 15
|
Watershed |
Precipitation Percentile |
Climate
Division |
Temperature Percentile |
|
Virgin |
70.00 |
CD1 |
77.06 |
|
|
66.67 |
CD2 |
90.83 |
|
Little |
27.27 |
CD3 |
90.83 |
|
Verde |
48.48 |
CD4 |
95.41 |
|
Bill
Williams |
33.33 |
CD5 |
88.07 |
|
|
21.21 |
CD6 |
94.50 |
|
|
45.45 |
CD7 |
100.00 |
|
Salt |
24.24 |
|
|
|
|
69.70 |
|
|
|
|
33.33 |
|
|
|
|
6.06 |
|
|
|
San Pedro |
21.21 |
|
|
|
Willcox
Playa |
39.39 |
|
|
|
San Simon |
12.12 |
|
|
|
White
Water Draw |
51.52 |
|
|
NOVEMBER 2003 – OCTOBER 2007
(48-month): percentiles of temperature, and
precipitation for the 15
November 2007
The
following summary describes the heat and dryness across the state for the 1-,
3-, 6-, 12-, 24-, 36-, and 48-month periods.
SUMMARY
October
was extremely dry, with all watersheds, except the lower
The 3-month period
of August through October, was near average on the upper
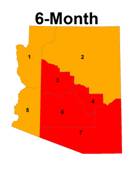
The 6-month period
rainfall was near average for much of the state, and below average in the south
central watersheds. The lower Gila had
slightly above average rainfall in the past 6 months, due to heavy July
precipitation in Gila Bend, Laveen, and Wickenburg. Temperatures in the northern and western part
of the state were around the 93rd percentile, and in the
southeastern part of the state the temperatures were between the 95th
and 98th percentile. Some
early frontal systems brought cooler weather to the higher elevations, and the
first freezing temperature was reported in September, and nighttime
temperatures have dropped below freezing regularly at the higher elevations.
The 12-month period
has been extremely dry in most of the state.
Three watersheds in the southern part of the state were between the 8th
and 14th percentile, and the other 12 watersheds were all below the
23rd percentile, putting this year on the dry side of the drought
tally. The entire state continued to
have temperatures above the 85th percentile during the previous 12
months. Many locations had daily records
tied or broken for both maximum and minimum temperatures.
The two year period
continues to show the driest conditions of all periods. The last wet year was 2005, with high
precipitation totals for both winter and summer in most places. Since then, we have had two very dry years,
punctuated with an occasional wet month, usually in summer. The Virgin, Bill Williams, Agua Fria, Salt,
The 36-month
precipitation period continues to show the results of the wet winter of 2004-05
in northern and western
The 48-month period
precipitation is also above average across the northern part of the state, and
well below average in south central