State Precipitation &
Temperature Update for
Conditions through October 2008
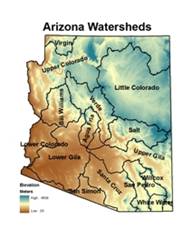
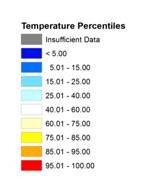
Precipitation
is monitored for the state of
Here, precipitation
percentile values for the most recent month, along with previous 3-, 6-, 12-,
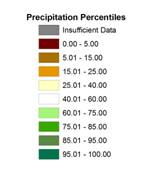
24-, 36-, and 48-month total are shown for each watershed. Low percentile values (brown shading) indicate
dry conditions while high values (green shading) indicate wet conditions. For
example, a precipitation total that falls at the 100th percentile
means that it is the highest precipitation total for the 1971-present period.
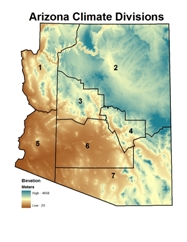 Temperature is monitored for the state of
Here, temperature
percentile values for the most recent month, along with previous 3-, 6-, 12-,
24-, 36-, and 48-month averages are shown for each climate division. Low percentile values (blue shading) indicate
cool conditions while high values (orange/red shading) indicate hot conditions.
For example, a temperature that falls at the 100th percentile means
that it is the highest average temperature for the 1895-present period.
The maps of the seven
periods for precipitation and temperature are shown below, with tables of the
percentile values and descriptive text following the maps. Current update is 11/27/2008. The data are preliminary.
Precipitation Percentiles by Watershed
(through October 2008)
Temperature Percentiles by Climate
Division (through October 2008)
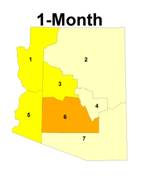
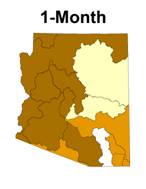
SHORT TERM CONDITIONS: 1-6 MONTHS
October was dry
everywhere in
|
Watershed |
Precipitation Percentile |
Climate
Division |
Temperature Percentile |
|
Virgin |
6.58 |
CD1 |
76.32 |
|
|
13.16 |
CD2 |
72.81 |
|
Little |
28.95 |
CD3 |
78.95 |
|
Verde |
10.53 |
CD4 |
69.74 |
|
Bill Williams |
13.16 |
CD5 |
79.39 |
|
|
10.53 |
CD6 |
85.53 |
|
|
13.16 |
CD7 |
68.86 |
|
Salt |
28.95 |
|
|
|
|
11.84 |
|
|
|
|
18.42 |
|
|
|
|
13.16 |
|
|
|
San Pedro |
42.11 |
|
|
|
Willcox
Playa |
15.79 |
|
|
|
San Simon |
21.05 |
|
|
|
White
Water Draw |
18.42 |
|
|
OCTOBER 2008: percentiles of precipitation for the 15
|
Watershed |
Precipitation Percentile |
Climate
Division |
Temperature Percentile |
|
Virgin |
11.11 |
CD1 |
86.73 |
|
|
31.58 |
CD2 |
81.14 |
|
Little |
10.53 |
CD3 |
86.84 |
|
Verde |
18.42 |
CD4 |
71.49 |
|
Bill
Williams |
23.68 |
CD5 |
92.11 |
|
|
15.79 |
CD6 |
92.98 |
|
|
76.32 |
CD7 |
54.39 |
|
Salt |
52.63 |
|
|
|
|
23.68 |
|
|
|
|
65.79 |
|
|
|
|
28.95 |
|
|
|
San Pedro |
39.47 |
|
|
|
Willcox
Playa |
21.05 |
|
|
|
San Simon |
78.95 |
|
|
|
White Water
Draw |
26.32 |
|
|
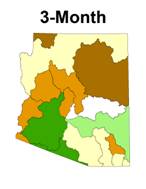
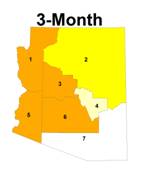
AUGUST 2008 - OCTOBER 2008 (3-month): percentiles of precipitation for the 15
|
Watershed |
Precipitation Percentile |
Climate
Division |
Temperature Percentile |
|
Virgin |
5.56 |
CD1 |
73.45 |
|
|
47.37 |
CD2 |
66.67 |
|
Little |
36.84 |
CD3 |
79.82 |
|
Verde |
44.74 |
CD4 |
41.67 |
|
Bill
Williams |
36.84 |
CD5 |
92.98 |
|
|
39.47 |
CD6 |
96.49 |
|
|
94.74 |
CD7 |
71.05 |
|
Salt |
81.58 |
|
|
|
|
50.00 |
|
|
|
|
89.47 |
|
|
|
|
68.42 |
|
|
|
San Pedro |
89.47 |
|
|
|
Willcox
Playa |
60.53 |
|
|
|
San Simon |
84.21 |
|
|
|
White
Water Draw |
54.05 |
|
|
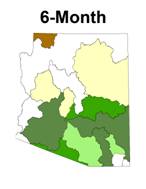
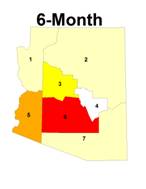
MAY 2008 – OCTOBER 2008 (6-month): percentiles of precipitation for the 15
INTERMEDIATE
TERM CONDITIONS: 12-24 MONTHS
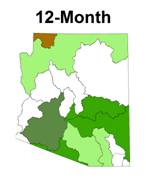
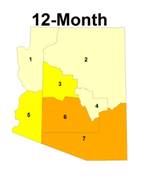
The 12-month period is
the wettest interval with 14 watersheds above the 40th percentile,
seven watersheds above the 67th percentile, and three watersheds
above the 83rd percentile.
The wettest watersheds were in southern
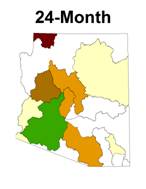
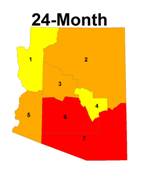
The 24-month period has
a large variation of conditions in the watersheds. Two watersheds are below the 14th
percentile, six are near the 50th percentile, and one watershed is
above the 80th percentile. Temperatures
for the 24-month period continue to be above the 75th percentile
across the state, with the coolest temperatures in Gila and Mohave counties,
and the warmest temperatures in Maricopa, Pinal, and the southeastern counties.
Watershed |
Precipitation Percentile |
Climate
Division |
Temperature Percentile |
|
Virgin |
8.57 |
CD1 |
71.68 |
|
|
72.97 |
CD2 |
67.26 |
|
Little |
45.95 |
CD3 |
77.88 |
|
Verde |
45.95 |
CD4 |
70.80 |
|
Bill
Williams |
40.54 |
CD5 |
83.63 |
|
|
48.65 |
CD6 |
88.50 |
|
|
91.89 |
CD7 |
90.27 |
|
Salt |
83.78 |
|
|
|
|
48.65 |
|
|
|
|
81.08 |
|
|
|
|
67.57 |
|
|
|
San Pedro |
67.57 |
|
|
|
Willcox
Playa |
55.56 |
|
|
|
San Simon |
83.78 |
|
|
|
White
Water Draw |
56.76 |
|
|
NOVEMBER 2008 – OCTOBER 2008
(12-month): percentiles of precipitation for
the 15
|
Watershed |
Precipitation Percentile |
Climate
Division |
Temperature Percentile |
|
Virgin |
3.03 |
CD1 |
75.89 |
|
|
44.44 |
CD2 |
87.05 |
|
Little |
30.56 |
CD3 |
90.18 |
|
Verde |
19.44 |
CD4 |
83.04 |
|
Bill
Williams |
13.89 |
CD5 |
90.18 |
|
|
16.67 |
CD6 |
95.54 |
|
|
80.56 |
CD7 |
96.43 |
|
Salt |
50.00 |
|
|
|
|
27.78 |
|
|
|
|
50.00 |
|
|
|
|
22.22 |
|
|
|
San Pedro |
44.44 |
|
|
|
Willcox
Playa |
33.33 |
|
|
|
San Simon |
55.56 |
|
|
|
White
Water Draw |
47.22 |
|
|
NOVEMBER 2007 – OCTOBER 2008
(24-month): percentiles of precipitation for
the 15
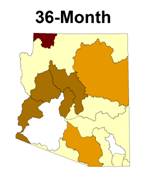
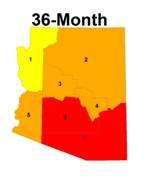
LONG TERM
CONDITIONS: 36-48 MONTHS
The 36-month period is
the driest long term period statewide, with the driest watersheds in west
central
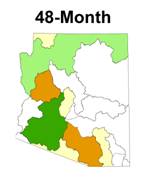
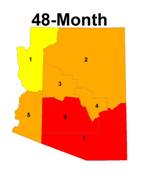
The 48-month period has
two watersheds (lower Gila and upper
|
|
Precipitation Percentile |
Climate
Division |
Temperature Percentile |
|
Virgin |
3.03 |
CD1 |
78.38 |
|
|
25.71 |
CD2 |
89.19 |
|
Little |
17.14 |
CD3 |
89.19 |
|
Verde |
11.43 |
CD4 |
91.89 |
|
Bill
Williams |
5.71 |
CD5 |
91.89 |
|
|
11.43 |
CD6 |
98.20 |
|
|
48.57 |
CD7 |
100.00 |
|
Salt |
28.57 |
|
|
|
|
14.29 |
|
|
|
|
37.14 |
|
|
|
|
22.86 |
|
|
|
San Pedro |
40.00 |
|
|
|
Willcox
Playa |
42.86 |
|
|
|
San Simon |
28.57 |
|
|
|
White
Water Draw |
40.00 |
|
|
NOVEMBER 2006 – OCTOBER 2008
(36-month): percentiles of temperature, and
precipitation for the 15
|
Watershed |
Precipitation Percentile |
Climate
Division |
Temperature Percentile |
|
Virgin |
32.26 |
CD1 |
75.45 |
|
|
67.65 |
CD2 |
90.00 |
|
Little |
41.18 |
CD3 |
88.18 |
|
Verde |
41.18 |
CD4 |
91.82 |
|
Bill
Williams |
20.59 |
CD5 |
88.18 |
|
|
32.35 |
CD6 |
98.18 |
|
|
76.47 |
CD7 |
100.00 |
|
Salt |
55.88 |
|
|
|
|
52.94 |
|
|
|
|
50.00 |
|
|
|
|
20.59 |
|
|
|
San Pedro |
38.24 |
|
|
|
Willcox
Playa |
41.18 |
|
|
|
San Simon |
35.29 |
|
|
|
White
Water Draw |
52.94 |
|
|
NOVEMBER 2005 – OCTOBER 2008
(48-month): percentiles of temperature, and
precipitation for the 15
November 2008
The
following summary describes the heat and dryness across the state for the 1-,
3-, 6-, 12-, 24-, 36-, and 48-month periods.
SUMMARY
October
was dry everywhere in
The 3-month period
was drier than average in all but three watersheds. The upper and lower Gila and
The 6-month period
precipitation, from May through October, was wetter than average in the
southern half of the state, and average or drier than average in the northern
half of the state. This year the monsoon
was very active in southern
The 12-month period
is the wettest interval with 14 watersheds above the 40th
percentile, seven watersheds above the 67th percentile, and three
watersheds above the 83rd percentile. The wettest watersheds were in southern
The 24-month period
has a large variation of conditions in the watersheds. Two watersheds are below the 14th
percentile, six are near the 50th percentile, and one watershed is
above the 80th percentile.
Temperatures for the 24-month period continue to be above the 75th
percentile across the state, with the coolest temperatures in Gila and Mohave
counties, and the warmest temperatures in Maricopa, Pinal, and the southeastern
counties.
The 36-month period
is the driest long term period statewide, with the driest watersheds in west
central
The 48-month period
has two watersheds (lower Gila and upper