State Climate Update for
November 2005
The
month of November was warm and very dry across the state. The mean monthly
temperature ranked between the 77th percentile in northeastern
|
|
Temperature |
Precipitation |
PDSI |
CD1 |
86.5% |
27.9% (1) |
91.9% |
|
CD2 |
77.5% |
11.7% (3) |
75.7% |
|
CD3 |
86.5% |
23.4% (2) |
81.1% |
|
CD4 |
82.9% |
13.5% (3) |
26.1% |
|
CD5 |
92.8% |
25.2% (1) |
98.2% |
|
CD6 |
93.7% |
14.4% (3) |
83.8% |
|
CD7 |
86.5% |
0.9% (4) |
21.6% |
1-month percentiles of temperature, precipitation (with
drought category), and Palmer Drought Severity Index for the 7
September 2005 – November 2005
Except for across western
|
|
Temperature |
Precipitation |
CD1 |
83.8% |
41.4% (0) |
|
CD2 |
79.3% |
12.6% (3) |
|
CD3 |
84.7% |
22.5% (2) |
|
CD4 |
82.9% |
15.3% (2) |
|
CD5 |
93.7% |
56.8% (0) |
|
CD6 |
96.4% |
12.6% (3) |
|
CD7 |
87.4% |
9.0% (3) |
3-month percentiles of temperature, and precipitation (with
drought category) for the 7
June 2005 – November 2005
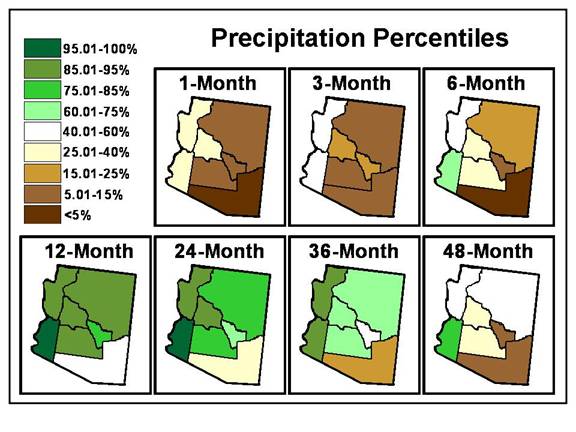
Six-month
precipitation values representing conditions across the summer and fall seasons
again indicate dryness for all of Arizona except for the western portion of the
state (CDs 1 and 5). The driest 6 months
occurred in two areas of the state riddled by drought over the past 6-9 years:
southeastern (CD 7: ‘extreme drought’)
and east-central (CD 4; ‘severe drought’)
|
|
Temperature |
Precipitation |
CD1 |
79.3% |
58.6% (0) |
|
CD2 |
68.5% |
18.9% (2) |
|
CD3 |
80.2% |
27.0% (1) |
|
CD4 |
74.8% |
12.6% (3) |
|
CD5 |
90.1% |
73.0% (0) |
|
CD6 |
94.6% |
38.7% (1) |
|
CD7 |
92.8% |
4.5% (4) |
6-month percentiles of temperature, and precipitation (with
drought category) for the 7
December 2004 – November 2005
There
is no evidence of drought within the state when examining precipitation totals
for the past 12-month period. In fact, most regions were characterized by well
above normal precipitation, including totals in the 90th percentile
for 4 of the 7 regions. The relatively drier area continues to be across the
southeast (CD 7; 42nd percentile). Temperatures across the state
were above normal for the past 12-month period, and most significantly so
across the southern (CDs 5, 6, and 7) and northeastern (CD 2) parts of the
state.
|
|
Temperature |
Precipitation |
CD1 |
80.9% |
94.6% (0) |
|
CD2 |
89.1% |
90.9% (0) |
|
CD3 |
84.6% |
90.0% (0) |
|
CD4 |
81.8% |
84.6% (0) |
|
CD5 |
88.2% |
95.5% (0) |
|
CD6 |
95.5% |
89.1% (0) |
|
CD7 |
90.9% |
42.7% (0) |
12-month percentiles of temperature, and
precipitation (with drought category) for the 7
December 2003 – November 2005
Twenty-four
month precipitation values continue to indicate rather wet conditions across
the state, as all regions but the southeast (CD 7) were comfortably above the
long-term median value, and well above across the western portion of the state.
The 2-year precipitation total was characteristic of “abnormally dry”
conditions across southeastern
|
|
Temperature |
Precipitation |
|
CD1 |
79.8% |
94.5% (0) |
|
CD2 |
89.0% |
78.0% (0) |
|
CD3 |
88.1% |
86.2% (0) |
|
CD4 |
94.5% |
62.4% (0) |
|
CD5 |
88.1% |
97.3% (0) |
|
CD6 |
90.8% |
80.7% (0) |
|
CD7 |
79.8% |
27.5% (1) |
24-month percentiles of temperature, and
precipitation (with drought category) for the 7
December 2002 – November 2005
Precipitation
totals for the longer-term 3-year period indicate conditions that are not as
wet when considering the past two years; however, the 36-month precipitation
totals were above average for 5 of the 7 climatic regions in Arizona, with
another region (east-central, CD 4) very near average (48th
percentile). Only across the southeastern portion of the state (CD 7; 15th
percentile) did the precipitation fall far below average. Here, the total
precipitation for the period is suggestive of ‘severe drought’ conditions.
Temperatures for the period were well above the historical median; however, to
some extent the longer 3-year time period likely reflects the more general
climatic changes of the past several decades.
|
|
Temperature |
Precipitation |
|
CD1 |
84.3% |
86.1% (0) |
|
CD2 |
92.6% |
67.6% (0) |
|
CD3 |
94.4% |
74.1% (0) |
|
CD4 |
97.2% |
48.2% (0) |
|
CD5 |
92.6% |
94.4% (0) |
|
CD6 |
95.4% |
72.2% (0) |
|
CD7 |
88.9% |
15.7% (3) |
36-month percentiles of temperature, and
precipitation (with drought category) for the 7
December 2001 – November 2005
Forty
eight-month precipitation values indicate clear evidence of longer-term drought
conditions across two areas of the state, with abnormally dry conditions across
another two areas. All regions within the state, except for the northwest (CD
1) and southwest (CD 5), have been characterized by less than average
precipitation over the 4-year period. Precipitation totals for the period
indicate ‘abnormally dry’ conditions across the west-central (CD 3) and
south-central (CD 6) portions of the state. Long-term conditions suggestive of
‘severe drought’ exist across southeastern (CD 7) and east-central (CD 4)
|
|
Temperature |
Precipitation |
|
CD1 |
85.1% |
52.3% (0) |
|
CD2 |
92.5% |
41.1% (0) |
|
CD3 |
97.2% |
33.6% (1) |
|
CD4 |
98.1% |
9.4% (3) |
|
CD5 |
93.5% |
81.3% (0) |
|
CD6 |
95.3% |
36.5% (1) |
|
CD7 |
95.3% |
10.3% (3) |
48-month percentiles of temperature, and
precipitation (with drought category) for the 7
Summary
November
2005 was characterized by warmth and dryness across the entire state, including
the driest November on record for southeastern
On
the longer term, there exists little or no evidence of drought across
Overall,
the southeastern and east-central regions of