State Precipitation &
Temperature Update for
Conditions through November
2007
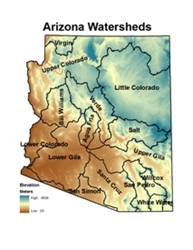
Precipitation
is monitored for the state of
Here, precipitation
percentile values for the most recent month, along with previous 3-, 6-, 12-,
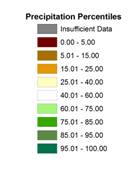
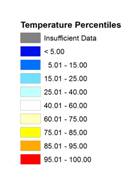
24-, 36-, and 48-month total are shown for each watershed. Low percentile values (brown shading) indicate
dry conditions while high values (green shading) indicate wet conditions. For
example, a precipitation total that falls at the 100th percentile
means that it is the highest precipitation total for the 1971-present period.
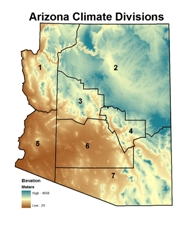 Temperature is monitored for the state of
Here, temperature
percentile values for the most recent month, along with previous 3-, 6-, 12-,
24-, 36-, and 48-month averages are shown for each climate division. Low percentile values (blue shading) indicate
cool conditions while high values (orange/red shading) indicate hot conditions.
For example, a temperature that falls at the 100th percentile means
that it is the highest average temperature for the 1895-present period.
The maps of the seven
periods for precipitation and temperature are shown below, with tables of the
percentile values and descriptive text following the maps. Current update is 12/26/2007. The data are preliminary.
Precipitation Percentiles by Watershed (through
November 2007)
Temperature Percentiles by Climate
Division (through November 2007)

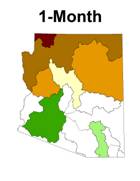
SHORT TERM CONDITIONS: 1-6 MONTHS
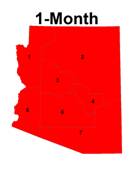
November was dry in
the northern half of the state and near or slightly above average for the
southern half of the state. After 28
days of dry conditions, most of the state received two days of moderate, steady
rainfall at the end of the month that prevented November from being one of the
driest on record. The big winners were
the lower Gila and San Pedro watersheds in the south, as the warm storm system
moved northward through
|
Watershed |
Precipitation Percentile |
Climate
Division |
Temperature Percentile |
|
Virgin |
4.17 |
CD1 |
98.23 |
|
|
10.81 |
CD2 |
100.00 |
|
Little |
18.92 |
CD3 |
97.35 |
|
Verde |
35.14 |
CD4 |
98.23 |
|
Bill
Williams |
16.22 |
CD5 |
98.23 |
|
|
56.76 |
CD6 |
100.00 |
|
|
78.38 |
CD7 |
97.35 |
|
Salt |
45.95 |
|
|
|
|
45.95 |
|
|
|
|
40.54 |
|
|
|
|
56.76 |
|
|
|
San Pedro |
70.27 |
|
|
|
Willcox
Playa |
51.39 |
|
|
|
San Simon |
48.65 |
|
|
|
White
Water Draw |
56.76 |
|
|
NOVEMBER 2007: percentiles of precipitation for the 15
|
Watershed |
Precipitation Percentile |
Climate
Division |
Temperature Percentile |
|
Virgin |
5.71 |
CD1 |
91.15 |
|
|
10.81 |
CD2 |
94.69 |
|
Little |
8.11 |
CD3 |
92.92 |
|
Verde |
24.32 |
CD4 |
94.69 |
|
Bill
Williams |
16.22 |
CD5 |
91.15 |
|
|
24.32 |
CD6 |
97.35 |
|
|
40.54 |
CD7 |
97.35 |
|
Salt |
21.62 |
|
|
|
|
32.43 |
|
|
|
|
16.22 |
|
|
|
|
24.32 |
|
|
|
San Pedro |
27.03 |
|
|
|
Willcox
Playa |
22.22 |
|
|
|
San Simon |
24.32 |
|
|
|
White
Water Draw |
21.62 |
|
|
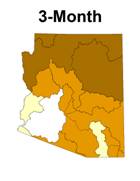
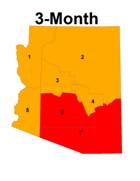
SEPTEMBER 2006 - NOVEMBER 2007
(3-month): percentiles of precipitation for
the 15
|
Watershed |
Precipitation Percentile |
Climate
Division |
Temperature Percentile |
|
Virgin |
2.86 |
CD1 |
86.73 |
|
|
43.24 |
CD2 |
98.23 |
|
Little |
40.54 |
CD3 |
95.58 |
|
Verde |
51.35 |
CD4 |
96.46 |
|
Bill
Williams |
43.24 |
CD5 |
93.81 |
|
|
29.73 |
CD6 |
99.12 |
|
|
86.49 |
CD7 |
99.12 |
|
Salt |
35.14 |
|
|
|
|
56.76 |
|
|
|
|
40.54 |
|
|
|
|
37.84 |
|
|
|
San Pedro |
45.95 |
|
|
|
Willcox
Playa |
44.44 |
|
|
|
San Simon |
32.43 |
|
|
|
White
Water Draw |
50.00 |
|
|
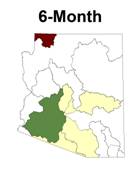
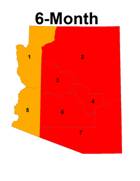
JUNE 2006 – NOVEMBER 2007 (6-month): percentiles of precipitation for the 15
INTERMEDIATE
TERM CONDITIONS: 12-24 MONTHS
The 12-month period continues
to be extremely dry across the entire state.
Four watersheds in the central part of the state, and one on the
southern border, were below the 11th percentile. All but one of the other 10 watersheds were
below the 39th percentile. Statewide
temperatures were above the 85th percentile during the previous 12
months, while the Colorado Plateau and southern
The driest interval
remains the 24 month period, with 12 of 15 watersheds below the 20th
percentile. Eight watersheds in
northwest, central, and south central
Watershed |
Precipitation Percentile |
Climate
Division |
Temperature Percentile |
|
Virgin |
2.94 |
CD1 |
85.71 |
|
|
25.00 |
CD2 |
96.43 |
|
Little |
13.89 |
CD3 |
94.64 |
|
Verde |
11.11 |
CD4 |
91.07 |
|
Bill
Williams |
11.11 |
CD5 |
90.18 |
|
|
11.11 |
CD6 |
96.43 |
|
|
55.56 |
CD7 |
96.43 |
|
Salt |
16.67 |
|
|
|
|
16.67 |
|
|
|
|
30.56 |
|
|
|
|
16.67 |
|
|
|
San Pedro |
19.44 |
|
|
|
Willcox
Playa |
30.56 |
|
|
|
San Simon |
11.11 |
|
|
|
White
Water Draw |
38.89 |
|
|
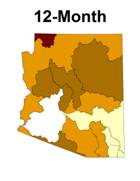
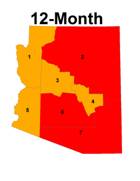
DECEMBER 2006 – NOVEMBER 2007
(12-month): percentiles of precipitation for
the 15
|
Watershed |
Precipitation Percentile |
Climate
Division |
Temperature Percentile |
|
Virgin |
3.03 |
CD1 |
80.18 |
|
|
14.29 |
CD2 |
93.69 |
|
Little |
17.14 |
CD3 |
91.89 |
|
Verde |
11.43 |
CD4 |
93.69 |
|
Bill Williams |
2.86 |
CD5 |
93.69 |
|
|
5.71 |
CD6 |
98.20 |
|
|
17.14 |
CD7 |
100.00 |
|
Salt |
11.43 |
|
|
|
|
20.00 |
|
|
|
|
20.00 |
|
|
|
|
8.57 |
|
|
|
San Pedro |
34.29 |
|
|
|
Willcox
Playa |
48.57 |
|
|
|
San Simon |
8.57 |
|
|
|
White
Water Draw |
42.86 |
|
|
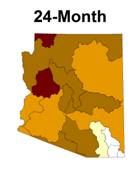
DECEMBER 2005 – NOVEMBER 2007
(24-month): percentiles of precipitation for
the 15
LONG TERM
CONDITIONS: 36-48 MONTHS
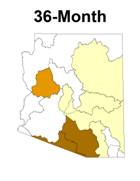
The 36-month precipitation
period is the closest to normal of all time periods. It combines two dry years (2004 and 2006)
with one very wet year (2005) Most of
western Arizona is near average, while eastern Arizona is below average at the
26th to 39th percentile, and southern Arizona is much
below average at the 8th to 12th percentile. This shows that although a good wet year is
helpful, it cannot erase the deficit.
Temperatures over the three-year period are similar to the two-year
period, with the northwest below the 79th percentile, and the others
all above the 88th percentile.
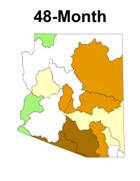
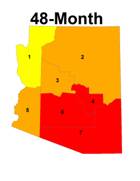
The 48-month period
precipitation is also near average across the western part of the state, and
well below-average in eastern and southern
Watershed |
Precipitation Percentile |
Climate
Division |
Temperature Percentile |
|
Virgin |
46.88 |
CD1 |
78.18 |
|
|
47.06 |
CD2 |
93.64 |
|
Little |
29.41 |
CD3 |
92.73 |
|
Verde |
41.18 |
CD4 |
93.64 |
|
Bill
Williams |
17.65 |
CD5 |
88.18 |
|
|
29.41 |
CD6 |
98.18 |
|
|
50.00 |
CD7 |
100.00 |
|
Salt |
38.24 |
|
|
|
|
55.88 |
|
|
|
|
35.29 |
|
|
|
|
11.76 |
|
|
|
San Pedro |
26.47 |
|
|
|
Willcox
Playa |
41.18 |
|
|
|
San Simon |
8.82 |
|
|
|
White
Water Draw |
44.12 |
|
|
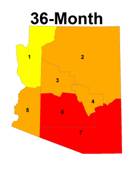
DECEMBER 2004 – NOVEMBER 2007
(36-month): percentiles of temperature, and
precipitation for the 15
|
Watershed |
Precipitation Percentile |
Climate
Division |
Temperature Percentile |
|
Virgin |
63.33 |
CD1 |
77.06 |
|
|
57.58 |
CD2 |
89.91 |
|
Little |
21.21 |
CD3 |
92.66 |
|
Verde |
42.42 |
CD4 |
96.33 |
|
Bill
Williams |
30.30 |
CD5 |
88.99 |
|
|
21.21 |
CD6 |
99.08 |
|
|
48.48 |
CD7 |
100.00 |
|
Salt |
24.24 |
|
|
|
|
63.64 |
|
|
|
|
33.33 |
|
|
|
|
6.06 |
|
|
|
San Pedro |
24.24 |
|
|
|
Willcox
Playa |
36.36 |
|
|
|
San Simon |
9.09 |
|
|
|
White
Water Draw |
45.45 |
|
|
DECEMBER 2003 – NOVEMBER 2007
(48-month): percentiles of temperature, and
precipitation for the 15
December 2007 Arizona
Drought Update based on precipitation data through November 2007)
The
following summary describes the heat and dryness across the state for the 1-,
3-, 6-, 12-, 24-, 36-, and 48-month periods.
SUMMARY
November
was dry in the northern half of the state and near or slightly above average
for the southern half of the state.
After 28 days of dry conditions, most of the state received two days of
moderate, steady rainfall at the end of the month that prevented November from
being one of the driest on record. The
big winners were the lower Gila and San Pedro watersheds in the south, as the
warm storm system moved northward through
The 3-month period
of September through November was unusually dry everywhere in the state, but
especially so across the northern half of the state, on the Colorado
Plateau. The southern half of the state
benefited from the end of the monsoon in September, which brought a few storms
to the southern watersheds. The clear
skies and dry weather during the fall have pushed the temperatures above the 91st
percentile everywhere in the state. The
southern half of the state was above the 97th percentile.
The 6-month period
rainfall was near average for most of the state. The lower Gila had above-average rainfall,
while the Salt and Agua Fria watersheds in central
The 12-month period
continues to be extremely dry across the entire state. Four watersheds in the central part of the
state, and one on the southern border, were below the 11th
percentile. All but one of the other 10
watersheds were below the 39th percentile. Statewide temperatures were above the 85th
percentile during the previous 12 months, while the Colorado Plateau and
southern
The driest interval
remains the 24 month period, with 12 of 15 watersheds below the 20th
percentile. Eight watersheds in
northwest, central, and south central
The 36-month
precipitation period is the closest to normal of all time periods. It combines two dry years (2004 and 2006)
with one very wet year (2005) Most of
western Arizona is near average, while eastern Arizona is below average at the
26th to 39th percentile, and southern Arizona is much
below average at the 8th to 12th percentile. This shows that although a good wet year is
helpful, it cannot erase the deficit.
Temperatures over the three-year period are similar to the two-year
period, with the northwest below the 79th percentile, and the others
all above the 88th percentile.
The 48-month period
precipitation is also near average across the western part of the state, and
well below-average in eastern and southern