State Climate Update for
Conditions through March 2006
 The primary climate variables of temperature and
precipitation are monitored for the state of
The primary climate variables of temperature and
precipitation are monitored for the state of
Here, values for the
most recent month along with 3-, 6-, 12-, 24-, 36-, and 48-month mean
temperature and total precipitation values are ranked within a historical
context (1895-present) and the rankings are divided by the number of years of
data and multiplied by 100% to create percentiles. Low percentile values
indicate cool or dry conditions while high values indicate warm or wet
conditions. For example, a temperature that falls at the 100th
percentile means that it is the highest temperature for the period of record.
As the PDSI is a cumulative index that describes conditions as they have
evolved up to the present, only the value of the current month is translated to
a percentile.
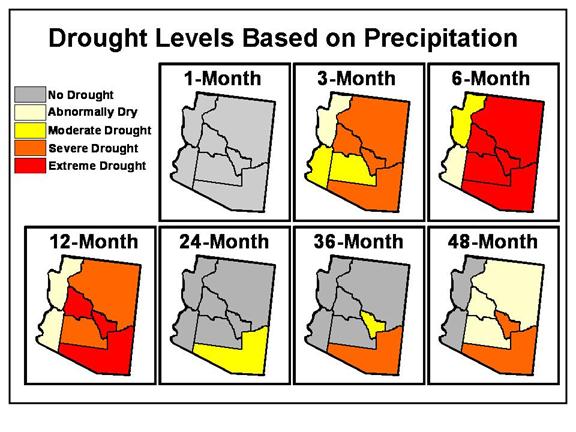
Based upon analysis
by the Monitoring Group of the Governor’s Drought Task Force, precipitation
data are stratified into the following drought categories:
|
Numerical Category |
Description |
Precipitation Percentile |
|
0 |
no drought |
40.01 – 100 |
|
1 |
abnormally dry |
25.01 – 40.00 |
|
2 |
moderate drought |
15.01 – 25.00 |
|
3 |
severe drought |
5.01 – 15.00 |
|
4 |
extreme drought |
0.00 – 5.00 |
SHORT
TERM CONDITIONS: 1-6 MONTHS
A change from the recent
warm and very dry conditions continued during March across
|
|
Temperature |
Precipitation |
PDSI |
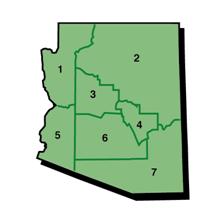
CD1 |
41.1 |
61.6 (0) |
62.5 |
|
CD2 |
30.4 |
65.2 (0) |
9.8 |
|
CD3 |
44.6 |
48.2 (0) |
10.7 |
|
CD4 |
33.9 |
58.0 (0) |
5.4 |
|
CD5 |
25.0 |
66.1 (0) |
81.3 |
|
CD6 |
48.2 |
73.2 (0) |
5.4 |
|
CD7 |
42.9 |
64.2 (0) |
9.8 |
MARCH 2006: percentiles of temperature,
precipitation (with drought category), and Palmer
Drought Severity Index for the 7
|
|
Temperature |
Precipitation |
CD1 |
80.4 |
26.3 (1) |
|
CD2 |
58.5 |
10.3 (3) |
|
CD3 |
81.3 |
9.8 (3) |
|
CD4 |
70.5 |
8.0 (3) |
|
CD5 |
68.6 |
18.8 (2) |
|
CD6 |
88.4 |
17.9 (2) |
|
CD7 |
78.6 |
10.7 (3) |
JANUARY 2006 - MARCH 2006: percentiles
of temperature, and precipitation (with
drought category) for the 7
|
|
Temperature |
Precipitation |
CD1 |
85.6 |
21.6 (2) |
|
CD2 |
72.5 |
3.6 (4) |
|
CD3 |
86.5 |
4.5 (4) |
|
CD4 |
82.9 |
1.8 (4) |
|
CD5 |
87.4 |
28.8 (1) |
|
CD6 |
96.4 |
3.6 (4) |
|
CD7 |
87.4 |
2.7 (4) |
OCTOBER 2005 – MARCH 2006: percentiles
of temperature, and precipitation (with
drought category) for the 7
INTERMEDIATE
TERM CONDITIONS: 12-24 MONTHS
The intermediate time
periods of 1 and 2 years define the break point in the more recent drought
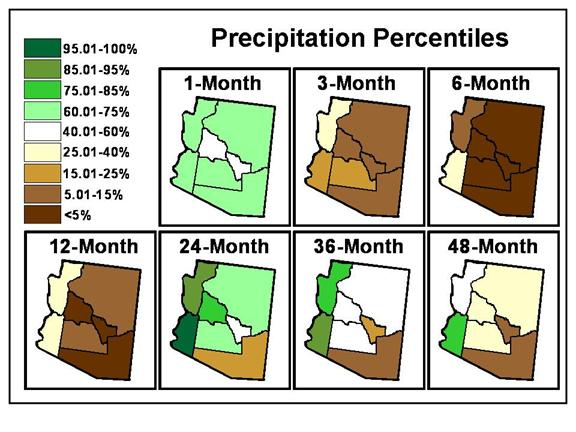
conditions. The past 12 months have been marked by dryness characteristic of
“extreme drought” across 3 of the 7
There is very little
evidence of drought within the state when examining precipitation totals for
the past 2 years. Only one region registered precipitation totals suggestive of
drought; precipitation for southeastern
Temperatures across
the state were well above normal for the past 2 years, and most significantly
so across southern
|
|
Temperature |
Precipitation |
CD1 |
77.5 |
28.4 (1) |
|
CD2 |
75.7 |
7.2 (3) |
|
CD3 |
86.5 |
4.5 (4) |
|
CD4 |
77.5 |
2.7 (4) |
|
CD5 |
89.2 |
36.9 (1) |
|
CD6 |
98.2 |
11.7 (3) |
|
CD7 |
94.6 |
1.8 (4) |
APRIL 2005 – MARCH 2006: percentiles
of temperature, and precipitation (with
drought category) for the 7
|
|
Temperature |
Precipitation |
|
CD1 |
77.3 |
91.8 (0) |
|
CD2 |
85.5 |
71.8 (0) |
|
CD3 |
85.5 |
76.4 (0) |
|
CD4 |
92.7 |
46.4 (0) |
|
CD5 |
83.6 |
95.5 (0) |
|
CD6 |
92.7 |
68.2 (0) |
|
CD7 |
81.8 |
19.6 (2) |
APRIL 2004 – MARCH 2006: percentiles
of temperature, and precipitation (with
drought category) for the 7
LONG
TERM CONDITIONS: 36-48 MONTHS
The pattern of precipitation
rankings for the longer-term 3-year period across the state closely matches
that for the past 2-year period. The 36-month precipitation totals were above
average for 5 of the 7 climate divisions in
Dryness is more
evident for the longer 4-year period. Only two regions of the state
(northwestern (CD 1) and southwestern (CD 5)) are characterized by 4-year
precipitation totals that are above average, while three regions of the state
(northeastern (CD 2), west-central (CD 3), south-central (CD 6)) can be
characterized as “abnormally dry” over the past 4 years. The long-term
problematic areas within the state are the east-central (CD 4) and southeastern
(CD 7) regions, where 4-year precipitation totals are suggestive of “severe
drought” conditions.
Temperatures for the
period were well above the historical median; however, to some extent the
longer time periods likely reflect the general climatic changes of the past
several decades in addition to the recent warmth that typically accompanies
dryness in
|
|
Temperature |
Precipitation |
|
CD1 |
84.4 |
78.9 (0) |
|
CD2 |
90.4 |
51.4 (0) |
|
CD3 |
92.7 |
53.2 (0) |
|
CD4 |
97.3 |
23.9 (2) |
|
CD5 |
89.9 |
88.1 (0) |
|
CD6 |
97.3 |
52.3 (0) |
|
CD7 |
94.5 |
12.8 (3) |
APRIL 2003 – MARCH 2006: percentiles
of temperature, and precipitation (with
drought category) for the 7
|
|
Temperature |
Precipitation |
|
CD1 |
84.3 |
57.4 (0) |
|
CD2 |
91.7 |
38.0 (1) |
|
CD3 |
97.2 |
35.2 (1) |
|
CD4 |
98.2 |
11.1 (3) |
|
CD5 |
91.7 |
79.6 (0) |
|
CD6 |
98.2 |
37.0 (1) |
|
CD7 |
97.2 |
9.3 (3) |
APRIL 2002 – MARCH 2006: percentiles
of temperature, and precipitation (with
drought category) for the 7
SUMMARY
●
The recent warm and extremely dry conditions abated in
March across the entire state of
●
Precipitation totals for the past 3- and 6-month periods are very low, with much
of the state characterized by amounts indicative of “severe” to “extreme” short-term
drought over the past 3 to 6 months.
●
The Palmer Drought Severity Index (PDSI) has fallen dramatically since the wet
winter of 2004-05. The PDSI indicates moist conditions only along the western
edge of the state (CDs 1 and 5); elsewhere, the PDSI signals very dry
conditions.
●
The past 12 months have been marked by dryness characteristic
of “extreme” or “severe” drought across 5 of the 7
●
There is very little evidence of drought within the
state when examining precipitation totals for the past 2 years; drought is
evident only across southeastern
●
The 36-month precipitation totals are above average
for 5 of the 7 climate divisions in
● The
long-term problematic areas within the state are the east-central and
southeastern regions, where 4-year precipitation totals are suggestive of
“severe drought” conditions.