State Precipitation &
Temperature Update for
Conditions through June 2006
Precipitation
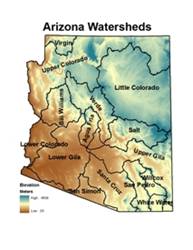
is monitored for the state of
Here, precipitation
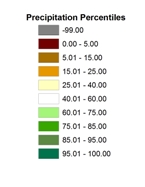
percentile values for the most recent month, along with previous 3-, 6-, 12-,
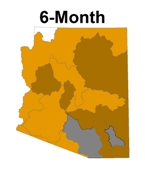
24-, 36-, and 48-month total are shown for each watershed. Low percentile values (brown shading)
indicate dry conditions while high values (green shading) indicate wet
conditions. For example, a precipitation total that falls at the 100th
percentile means that it is the highest precipitation total for the
1971-present period.
 Temperature is monitored for the state of
Here, temperature
percentile values for the most recent month, along with previous 3-, 6-, 12-,
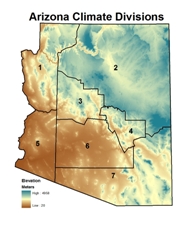
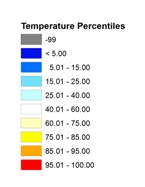
24-, 36-, and 48-month averages are shown for each climate division. Low percentile values (blue shading) indicate
cool conditions while high values (orange/red shading) indicate hot conditions.
For example, a temperature that falls at the 100th percentile means
that it is the highest average temperature for the 1895-present period.
The maps of the 7
periods for precipitation and temperature are shown below, with tables of the
percentile values and descriptive text following the maps. Values of -99 and grey shading indicate
missing data. When the data are available,
this product will be updated. Current
update is 08/01/2006.
Precipitation Percentiles by Watershed
(through June 2006)
Temperature Percentiles by Climate
Division (through June 2006)
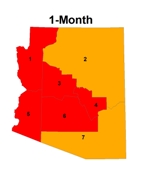
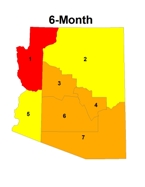
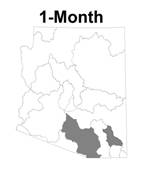
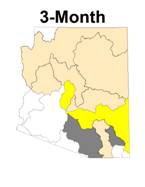
SHORT TERM CONDITIONS: 1-6 MONTHS
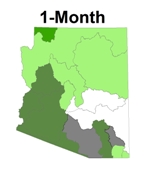
The month of June was
characterized by above average precipitation across the entire state, although
this should not imply a “wet” month, as normal precipitation for June is
low. All watersheds except the Salt and
|
Watershed |
Precipitation Percentile |
Climate
Division |
Temperature
Percentile |
|
Virgin |
78.57 |
CD1 |
92.86% |
|
|
75.00 |
CD2 |
96.43% |
|
Little |
69.44 |
CD3 |
95.54% |
|
Verde |
72.22 |
CD4 |
98.21% |
|
Bill
Williams |
86.11 |
CD5 |
99.11% |
|
|
75.00 |
CD6 |
98.21% |
|
|
94.44 |
CD7 |
93.75% |
|
Salt |
47.22 |
|
|
|
|
94.44 |
|
|
|
|
47.22 |
|
|
|
|
-99 |
|
|
|
San Pedro |
89.89 |
|
|
|
Willcox
Playa |
-99 |
|
|
|
San Simon |
94.44 |
|
|
|
White
Water Draw |
63.89 |
|
|
JUNE 2006: percentiles of precipitation for the 15
|
Watershed |
Precipitation Percentile |
Climate
Division |
Temperature
Percentile |
|
Virgin |
45.71 |
CD1 |
87.50% |
|
|
30.56 |
CD2 |
98.21% |
|
Little |
30.56 |
CD3 |
93.75% |
|
Verde |
27.78 |
CD4 |
93.75% |
|
Bill
Williams |
38.89 |
CD5 |
93.75% |
|
|
19.44 |
CD6 |
97.32% |
|
|
44.44 |
CD7 |
95.54% |
|
Salt |
27.78 |
|
|
|
|
72.22 |
|
|
|
|
16.67 |
|
|
|
|
-99 |
|
|
|
San Pedro |
33.33 |
|
|
|
Willcox
Playa |
-99 |
|
|
|
San Simon |
66.67 |
|
|
|
White
Water Draw |
44.44 |
|
|
APRIL 2006 - JUNE 2006 (3-month): percentiles of precipitation for the 15
|
Watershed |
Precipitation Percentile |
Climate
Division |
Temperature
Percentile |
|
Virgin |
55.88 |
CD1 |
78.57% |
|
|
19.44 |
CD2 |
95.54% |
|
Little |
14.29 |
CD3 |
89.29% |
|
Verde |
16.67 |
CD4 |
93.75% |
|
Bill
Williams |
11.11 |
CD5 |
84.82% |
|
|
13.89 |
CD6 |
94.64% |
|
|
16.67 |
CD7 |
94.64% |
|
Salt |
19.44 |
|
|
|
|
16.67 |
|
|
|
|
13.89 |
|
|
|
|
-99 |
|
|
|
San Pedro |
11.11 |
|
|
|
Willcox
Playa |
-99 |
|
|
|
San Simon |
16.67 |
|
|
|
White
Water Draw |
11.43 |
|
|
JANUARY 2005 – JUNE 2006 (6-month): percentiles of precipitation for the 15
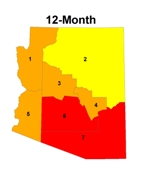
INTERMEDIATE
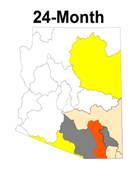
TERM CONDITIONS: 12-24 MONTHS
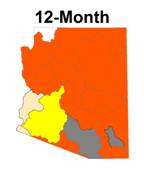
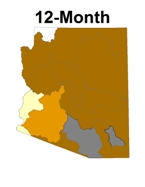
The intermediate time
periods of 1- and 2-years show the importance of the historical context of
drought. The 1-year period precipitation
has been below the 15th percentile for all watersheds except the 3
along our western border. The
corresponding temperatures for the 1-year period have been among the highest
ever, particularly in the southeast and south central climate divisions.
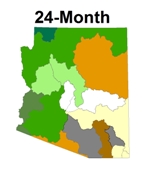
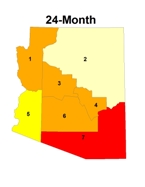
In stark contrast,
the 2-year period shows very little evidence of drought across the western and
central portions of the state, with precipitation totals well above
normal. The Little Colorado and the
southeastern watersheds show precipitation totals below the 30% percentile,
with the driest watershed being the San Pedro. This 2-year period includes the
extremely wet winter of 2005. Except for
climate division 1 in the northwest, temperatures for the 2-year period were
all at or above the 80th percentile.
Watershed |
Precipitation Percentile |
Climate
Division |
Temperature
Percentile |
|
Virgin |
48.48 |
CD1 |
78.38% |
|
|
11.43 |
CD2 |
91.89% |
|
Little |
11.43 |
CD3 |
91.89% |
|
Verde |
11.43 |
CD4 |
94.59% |
|
Bill
Williams |
14.29 |
CD5 |
86.49% |
|
|
8.57 |
CD6 |
95.50% |
|
|
20.00 |
CD7 |
98.20% |
|
Salt |
8.57 |
|
|
|
|
31.43 |
|
|
|
|
8.57 |
|
|
|
|
-99 |
|
|
|
San Pedro |
5.71 |
|
|
|
Willcox
Playa |
-99 |
|
|
|
San Simon |
5.71 |
|
|
|
White
Water Draw |
14.71 |
|
|
JULY 2005 – JUNE 2006 (12-month): percentiles of precipitation for the 15
|
Watershed |
Precipitation Percentile |
Climate
Division |
Temperature
Percentile |
|
Virgin |
96.88 |
CD1 |
72.73% |
|
|
82.35 |
CD2 |
89.09% |
|
Little |
23.53 |
CD3 |
88.18% |
|
Verde |
70.59 |
CD4 |
92.73% |
|
Bill
Williams |
73.53 |
CD5 |
80.00% |
|
|
55.88 |
CD6 |
88.18% |
|
|
67.65 |
CD7 |
95.45% |
|
Salt |
44.12 |
|
|
|
|
91.18 |
|
|
|
|
32.35 |
|
|
|
|
-99 |
|
|
|
San Pedro |
11.76 |
|
|
|
Willcox
Playa |
-99 |
|
|
|
San Simon |
20.59 |
|
|
|
White
Water Draw |
26.47 |
|
|
JULY 2004 – JUNE 2006 (24-month): percentiles of precipitation for the 15
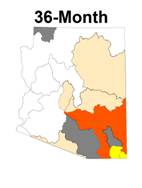
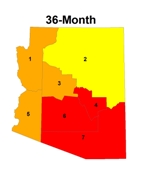
LONG TERM
CONDITIONS: 36-48 MONTHS
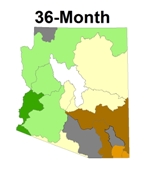
The pattern of
precipitation rankings for the longer-term 3-year period across the state is
similar to that of the 2-year period, but includes another very dry winter from
2003-2004. Again, the western and northern watershed precipitation totals were
at or above average. Across the eastern
and south central watersheds, precipitation fell far below average. The Salt,
Verde and Little Colorado watersheds had abnormally dry conditions, while the
southeast watersheds had precipitation below the 20th
percentile. Except for the climate
divisions along the
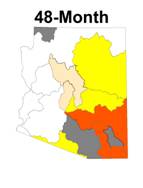
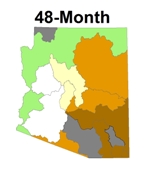
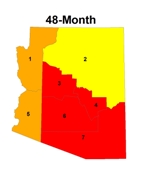
The length of the
current drought and warming is more evident when looking at the longer 4-year
period. Only the Upper and Lower
Colorado, Bill Williams, and
Watershed |
Precipitation Percentile |
Climate
Division |
Temperature
Percentile |
|
Virgin |
-99 |
CD1 |
78.90% |
|
|
63.64 |
CD2 |
94.50% |
|
Little |
27.27 |
CD3 |
92.66% |
|
Verde |
51.52 |
CD4 |
97.25% |
|
Bill
Williams |
60.61 |
CD5 |
87.16% |
|
|
36.36 |
CD6 |
96.33% |
|
|
60.61 |
CD7 |
100.00% |
|
Salt |
33.33 |
|
|
|
|
75.76 |
|
|
|
|
12.12 |
|
|
|
|
-99 |
|
|
|
San Pedro |
9.09 |
|
|
|
Willcox
Playa |
-99 |
|
|
|
San Simon |
30.30 |
|
|
|
White
Water Draw |
18.18 |
|
|
JULY 2003 – JUNE 2006 (36-month): percentiles of temperature, and precipitation for the 15
|
Watershed |
Precipitation Percentile |
Climate
Division |
Temperature
Percentile |
|
Virgin |
-99 |
CD1 |
80.56% |
|
|
62.50 |
CD2 |
91.67% |
|
Little |
21.88 |
CD3 |
96.30% |
|
Verde |
37.50 |
CD4 |
98.15% |
|
Bill
Williams |
43.75 |
CD5 |
90.74% |
|
|
37.50 |
CD6 |
98.15% |
|
|
50.00 |
CD7 |
100.00% |
|
Salt |
21.88 |
|
|
|
|
75.00 |
|
|
|
|
12.50 |
|
|
|
|
-99 |
|
|
|
San Pedro |
6.25 |
|
|
|
Willcox
Playa |
-99 |
|
|
|
San Simon |
18.75 |
|
|
|
White
Water Draw |
6.25 |
|
|
JULY 2002 – JUNE 2006 (48-month): percentiles of temperature, and precipitation for the 15
July 2006
The following
summary describes the drought conditions based only on precipitation. This practice of categorizing the drought in
terms of precipitation only will be discontinued as the long term impacts of
drought in
SUMMARY
●
The recent dry conditions that have existed since March continue in June,
although the meager precipitation is statistically above the normal June
rainfall for most of the state. The
1-month precipitation picture gives a false impression that the drought has
been alleviated.
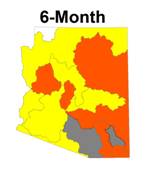
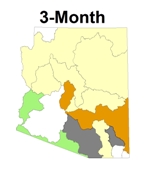
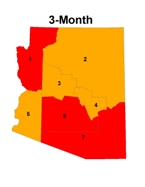
●
Precipitation totals for the past 3- and 6-month periods are very low, with
much of the state characterized by amounts indicative of “moderate” to “severe”
short-term drought.
●
The past 12 months have been marked by dryness characteristic of “severe”
drought across 10 of the 15
●
There is very little evidence of drought across the west, north and central
watersheds of the state when examining precipitation totals for the past 2
years. Drought is evident in the Little
Colorado and across southeastern
●
The 36-month precipitation totals are at or above average for the 5 western
watersheds in
● The long-term problematic areas
within the state are the east-central and southeastern regions, where 4-year
precipitation totals are suggestive of “severe drought” conditions.
|
Numerical Category |
Description |
Precipitation Percentile |
|
0 |
No drought |
40.01 – 100 |
|
1 |
abnormally dry |
25.01 – 40.00 |
|
2 |
moderate drought |
15.01 – 25.00 |
|
3 |
severe drought |
5.01 – 15.00 |
|
4 |
extreme drought |
0.00 – 5.00 |
|
5 |
insufficient data |
|