State Precipitation &
Temperature Update for
Conditions through July 2006
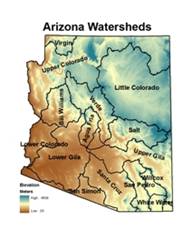
Precipitation
is monitored for the state of
Here, precipitation
percentile values for the most recent month, along with previous 3-, 6-, 12-,
24-, 36-, and 48-month total are shown for each watershed. Low percentile values (brown shading) indicate
dry conditions while high values (green shading) indicate wet conditions. For
example, a precipitation total that falls at the 100th percentile
means that it is the highest precipitation total for the 1971-present period.
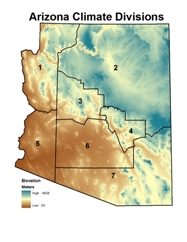 Temperature is monitored for the state of
Here, temperature
percentile values for the most recent month, along with previous 3-, 6-, 12-,
24-, 36-, and 48-month averages are shown for each climate division. Low percentile values (blue shading) indicate
cool conditions while high values (orange/red shading) indicate hot conditions.
For example, a temperature that falls at the 100th percentile means
that it is the highest average temperature for the 1895-present period.
The maps of the seven
periods for precipitation and temperature are shown below, with tables of the
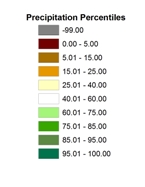
percentile values and descriptive text following the maps. Values of -99 and grey shading indicate
missing data. When the data are
available, this product will be updated.
Current update is 08/25/2006.
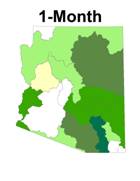
Precipitation Percentiles by Watershed
(through July 2006)
Temperature Percentiles by Climate
Division (through July 2006)
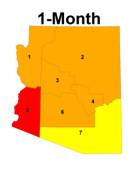
SHORT TERM CONDITIONS: 1-6 MONTHS
The month of July was
characterized by average or above average precipitation across the entire state,
except the Bill Williams watershed in east central
|
Watershed |
Precipitation Percentile |
Climate
Division |
Temperature
Percentile |
|
Virgin |
55.71 |
CD1 |
85.71% |
|
|
75.00 |
CD2 |
90.18% |
|
Little |
88.89 |
CD3 |
90.18% |
|
Verde |
75.00 |
CD4 |
93.75% |
|
Bill
Williams |
38.89 |
CD5 |
95.54% |
|
|
58.33 |
CD6 |
91.96% |
|
|
50.00 |
CD7 |
78.57% |
|
Salt |
83.33 |
|
|
|
|
77.78 |
|
|
|
|
77.78 |
|
|
|
|
91.67 |
|
|
|
San Pedro |
100.00 |
|
|
|
Willcox
Playa |
63.89 |
|
|
|
San Simon |
75.00 |
|
|
|
White
Water Draw |
57.14 |
|
|
JULY 2006: percentiles of precipitation for the 15
|
Watershed |
Precipitation Percentile |
Climate
Division |
Temperature
Percentile |
|
Virgin |
54.29 |
CD1 |
91.96% |
|
|
55.56 |
CD2 |
98.21% |
|
Little |
80.56 |
CD3 |
93.75% |
|
Verde |
72.22 |
CD4 |
95.54% |
|
Bill
Williams |
38.89 |
CD5 |
98.21% |
|
|
38.89 |
CD6 |
98.21% |
|
|
58.33 |
CD7 |
96.43% |
|
Salt |
72.22 |
|
|
|
|
77.78 |
|
|
|
|
66.67 |
|
|
|
|
91.67 |
|
|
|
San Pedro |
100.00 |
|
|
|
Willcox
Playa |
58.33 |
|
|
|
San Simon |
75.00 |
|
|
|
White
Water Draw |
57.14 |
|
|
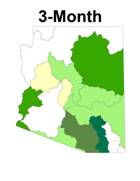
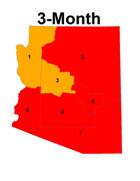
MAY 2006 - JULY 2006 (3-month): percentiles of precipitation for the 15
|
Watershed |
Precipitation Percentile |
Climate
Division |
Temperature
Percentile |
|
Virgin |
48.57 |
CD1 |
79.46% |
|
|
25.00 |
CD2 |
94.64% |
|
Little |
44.44 |
CD3 |
91.96% |
|
Verde |
38.89 |
CD4 |
93.75% |
|
Bill
Williams |
11.11 |
CD5 |
88.39% |
|
|
16.67 |
CD6 |
94.64% |
|
|
36.11 |
CD7 |
92.86% |
|
Salt |
38.89 |
|
|
|
|
36.11 |
|
|
|
|
27.78 |
|
|
|
|
61.11 |
|
|
|
San Pedro |
83.33 |
|
|
|
Willcox
Playa |
22.86 |
|
|
|
San Simon |
36.11 |
|
|
|
White
Water Draw |
20.00 |
|
|
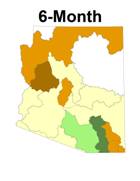
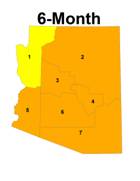
FEBRUARY 2005 – JULY 2006 (6-month): percentiles of precipitation for the 15
INTERMEDIATE
TERM CONDITIONS: 12-24 MONTHS
The intermediate time
periods of 1- and 2-years show the importance of the historical context of
drought. The 1-year period precipitation
has been below the 15th percentile for all watersheds except the Virgin,
lower
In contrast, the
2-year period shows very little evidence of dryness across the western and west
central portions of the state, with precipitation totals above normal. However, the Little Colorado and the
southeastern watersheds show precipitation totals below the 35th percentile,
with the driest watersheds being the San Pedro and Willcox Playa. This 2-year
period still includes the extremely wet winter of 2005 with the extremely dry
winter of 2006. Except for climate
divisions 1 and 5 along the lower
Watershed |
Precipitation Percentile |
Climate
Division |
Temperature
Percentile |
|
Virgin |
53.12 |
CD1 |
77.48% |
|
|
11.43 |
CD2 |
90.99% |
|
Little |
14.29 |
CD3 |
90.09% |
|
Verde |
11.43 |
CD4 |
93.69% |
|
Bill
Williams |
14.29 |
CD5 |
85.59% |
|
|
5.71 |
CD6 |
94.59% |
|
|
11.43 |
CD7 |
95.50% |
|
Salt |
8.57 |
|
|
|
|
31.43 |
|
|
|
|
8.57 |
|
|
|
|
14.29 |
|
|
|
San Pedro |
34.29 |
|
|
|
Willcox
Playa |
14.71 |
|
|
|
San Simon |
5.71 |
|
|
|
White
Water Draw |
22.86 |
|
|
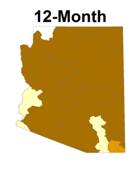
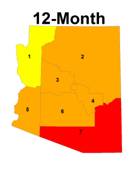
AUGUST 2005 – JULY 2006 (12-month): percentiles of precipitation for the 15
|
Watershed |
Precipitation Percentile |
Climate
Division |
Temperature
Percentile |
|
Virgin |
96.88 |
CD1 |
72.73% |
|
|
85.29 |
CD2 |
88.18% |
|
Little |
38.24 |
CD3 |
86.36% |
|
Verde |
67.65 |
CD4 |
90.91% |
|
Bill
Williams |
70.59 |
CD5 |
78.18% |
|
|
61.76 |
CD6 |
88.18% |
|
|
64.71 |
CD7 |
93.64% |
|
Salt |
47.06 |
|
|
|
|
91.18 |
|
|
|
|
35.29 |
|
|
|
|
17.65 |
|
|
|
San Pedro |
32.35 |
|
|
|
Willcox
Playa |
14.71 |
|
|
|
San Simon |
26.47 |
|
|
|
White
Water Draw |
26.47 |
|
|
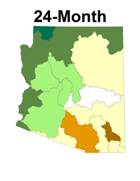
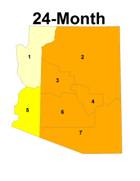
AUGUST 2004 – JULY 2006 (24-month): percentiles of precipitation for the 15
LONG TERM
CONDITIONS: 36-48 MONTHS
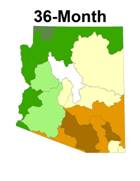
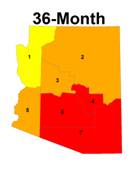
The pattern of precipitation
rankings for the longer-term 3-year period across the state is similar to that
of the 2-year period, but includes another very dry winter from 2003-2004. Again,
the western and northern watershed precipitation totals were at or above
average, the central watersheds were at or slight below normal, and the
southeastern watersheds were well below average. The entire state was above the 75th
percentile for temperature, and the 3-year period was among the warmest on
record in CD 7 in the southeast areas of the state.
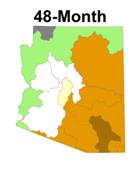
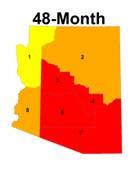
The length of the
current drought and warming is more evident when looking at the longer 4-year
period. The northern and western
watersheds have had near or above normal precipitation during the 4-year period,
while the eastern and southeastern watersheds have received precipitation well
below the 25th percentile. Along
with the dryness has been excessive heat, particularly in the southeast. Climate divisions 3, 4, 6, and 7 in the south
and south central areas have been above the 98th percentile in the
4-year period, with division 7 still having the hottest 4-year period on
record.
Watershed |
Precipitation Percentile |
Climate
Division |
Temperature
Percentile |
|
Virgin |
90.62 |
CD1 |
77.06% |
|
|
75.76 |
CD2 |
93.58% |
|
Little |
30.30 |
CD3 |
92.66% |
|
Verde |
54.55 |
CD4 |
96.33% |
|
Bill
Williams |
63.64 |
CD5 |
88.99% |
|
|
36.36 |
CD6 |
95.41% |
|
|
60.61 |
CD7 |
99.08% |
|
Salt |
36.36 |
|
|
|
|
75.76 |
|
|
|
|
18.18 |
|
|
|
|
12.12 |
|
|
|
San Pedro |
21.21 |
|
|
|
Willcox
Playa |
12.12 |
|
|
|
San Simon |
21.21 |
|
|
|
White
Water Draw |
27.27 |
|
|
AUGUST 2003 – JULY 2006 (36-month): percentiles of temperature, and precipitation for the 15
|
Watershed |
Precipitation Percentile |
Climate
Division |
Temperature
Percentile |
|
Virgin |
-99.99 |
CD1 |
79.63% |
|
|
65.62 |
CD2 |
90.74% |
|
Little |
18.75 |
CD3 |
96.30% |
|
Verde |
43.75 |
CD4 |
97.22% |
|
Bill Williams |
46.88 |
CD5 |
91.67% |
|
|
28.12 |
CD6 |
97.22% |
|
|
50.00 |
CD7 |
100.00% |
|
Salt |
25.00 |
|
|
|
|
75.00 |
|
|
|
|
18.75 |
|
|
|
|
15.62 |
|
|
|
San Pedro |
9.38 |
|
|
|
Willcox
Playa |
6.25 |
|
|
|
San Simon |
21.88 |
|
|
|
White
Water Draw |
25.00 |
|
|
AUGUST 2002 – JULY 2006 (48-month): percentiles of temperature, and precipitation for the 15
August 2006
The
following summary describes the heat and dryness across the state for the 1-,
3-, 6-, 12-, 24-, 36-, and 48-month periods.
This practice of categorizing the drought in terms of precipitation only
will be discontinued as the long term impacts of drought in
SUMMARY
●
The arrival of the above average monsoon rainfall has brought relief from the recent
dry conditions that have existed since March across most of the state. Although the 1 month rainfall does not end
the drought, it improves the rangeland conditions and provides short term
relief. The rainfall brought slightly
cooler temperatures, although all areas of the state were above the 75th
percentile for temperature.
●
Precipitation totals for the past 3- and 6-month periods were significantly
improved by the wet July, particularly across the eastern and south central
parts of the state. For the 6 month period, the north and northwest watersheds
are still well blow average reflecting the dry spring in those watersheds. The warm winter and hot summer have had the
greatest effect across the southern and western areas of the state.
●
The dryness over the past 12 months is evident with almost all watersheds below
the 15th percentile for precipitation. The biggest change in the 12 month period is
the San Pedro, which improved significantly with the wet July. The southeast has had temperatures above the
95th percentile for the 12-month period.
●
The west, north and central watersheds have had near or above average
precipitation for the past 24 months, while the eastern and southeast
watersheds have seen slightly to well below average precipitation in this
period. Temperatures along the western
border have been slightly above normal, but southeast and south central
●
The 36-month precipitation totals are still at or above average for the 5 western
watersheds in
● The long-term problematic areas
within the state remain the east-central and southeastern regions, where 4-year
precipitation totals are between the 15th dan 5th
percentile. These dry conditions are
exacerbated by temperatures above the 95th percentile across the
southeast, above the 85th percentile in the southwest and northeast,
and above the 75th percentile in the northwest.