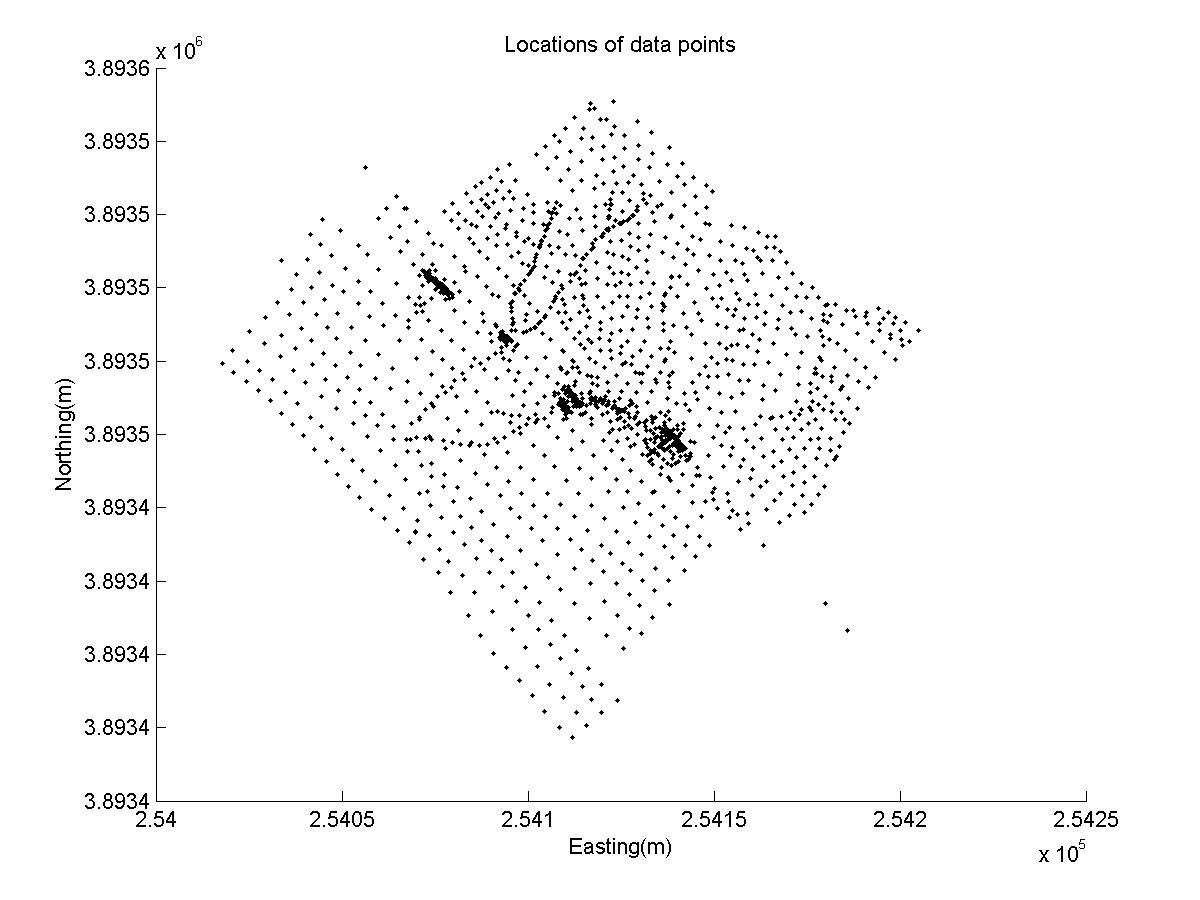
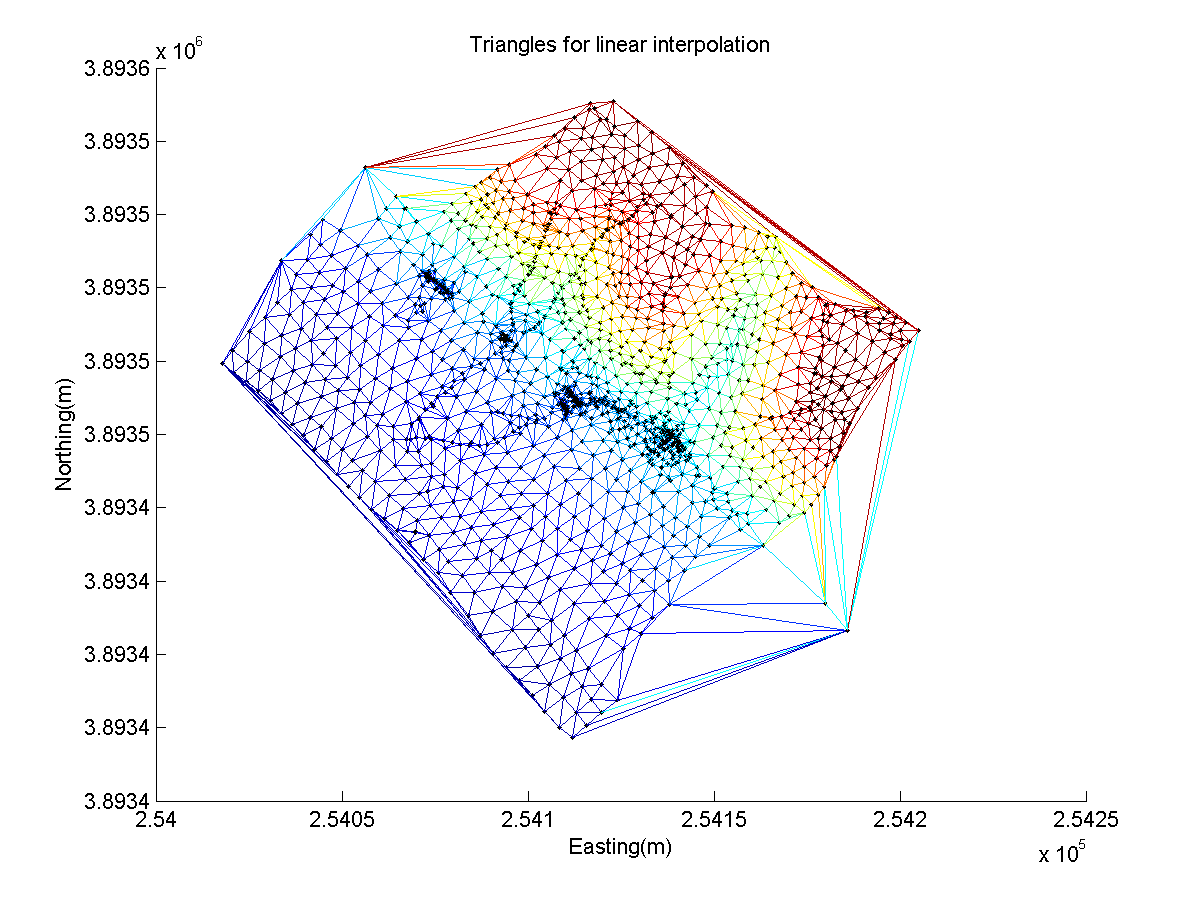
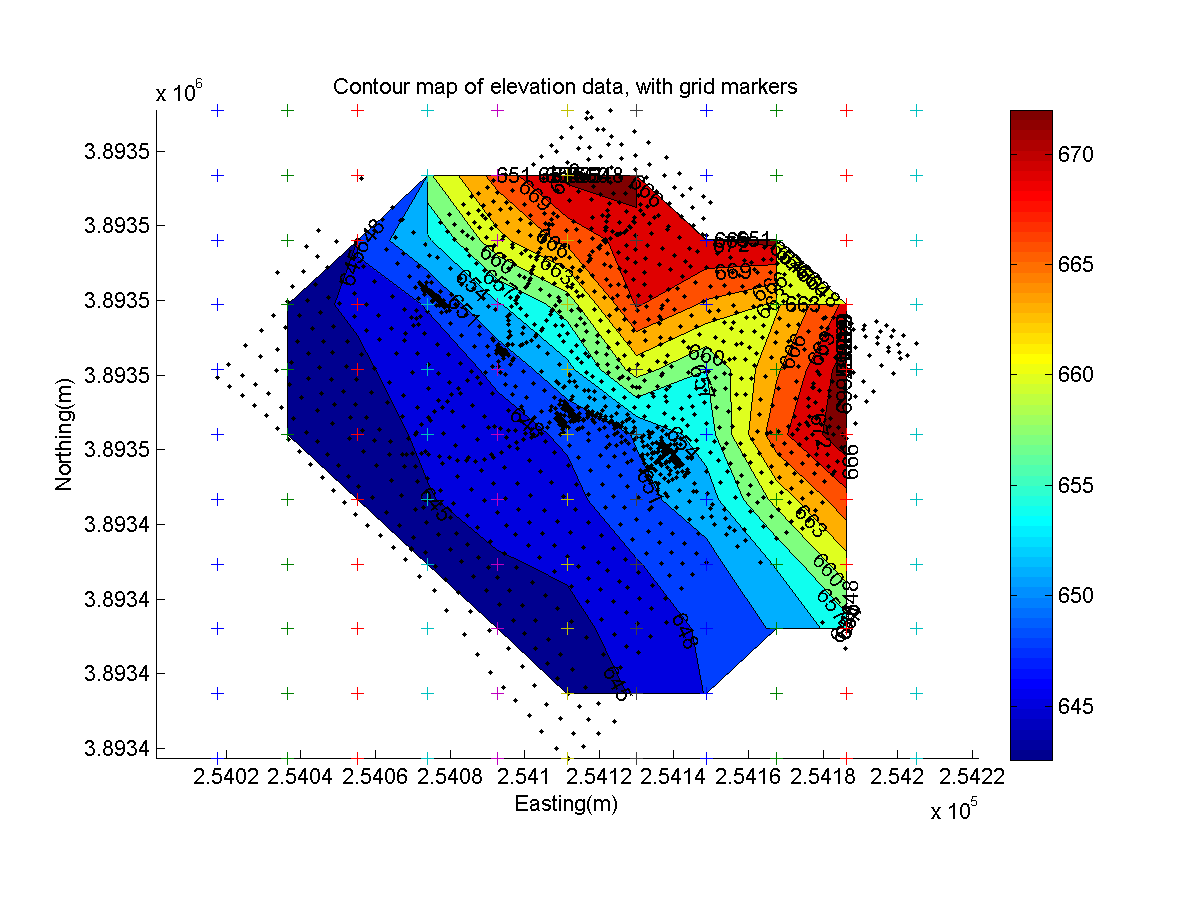
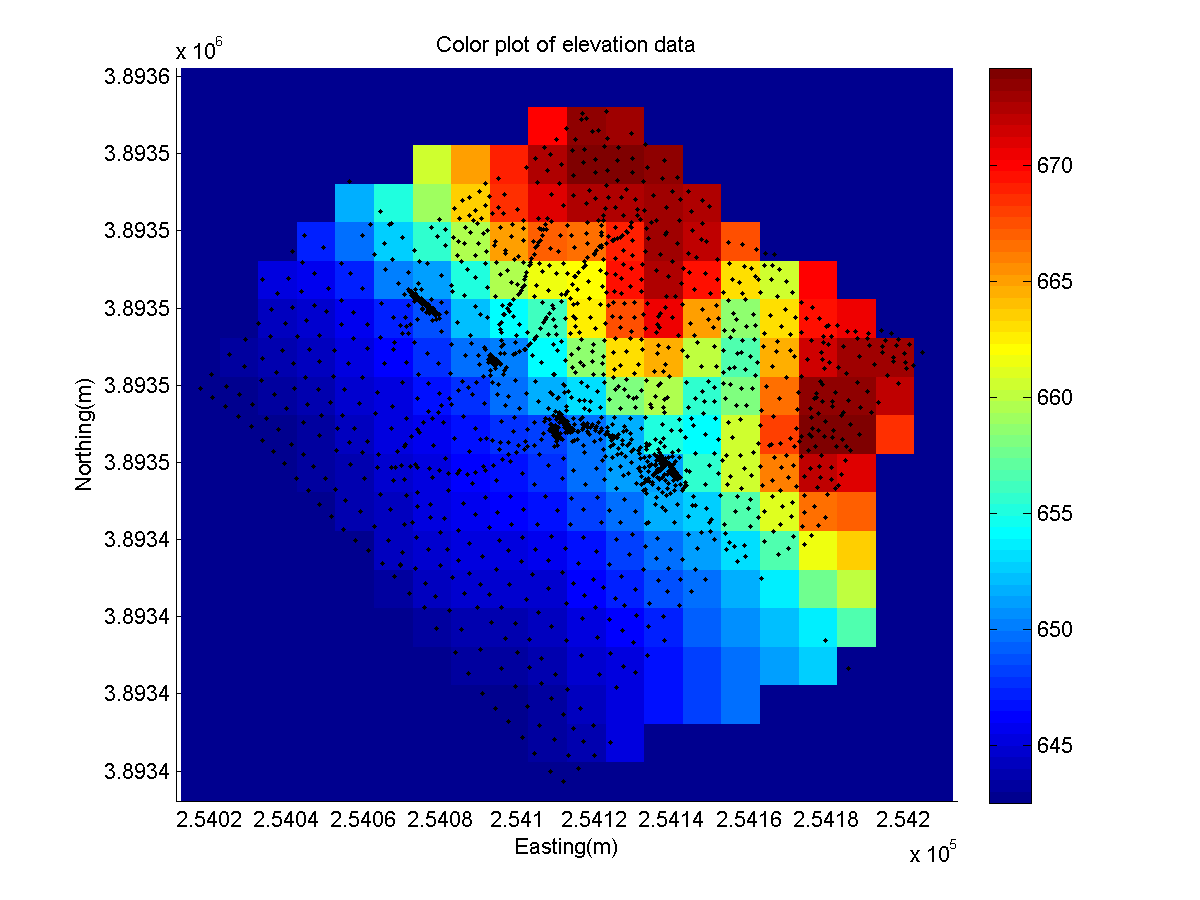
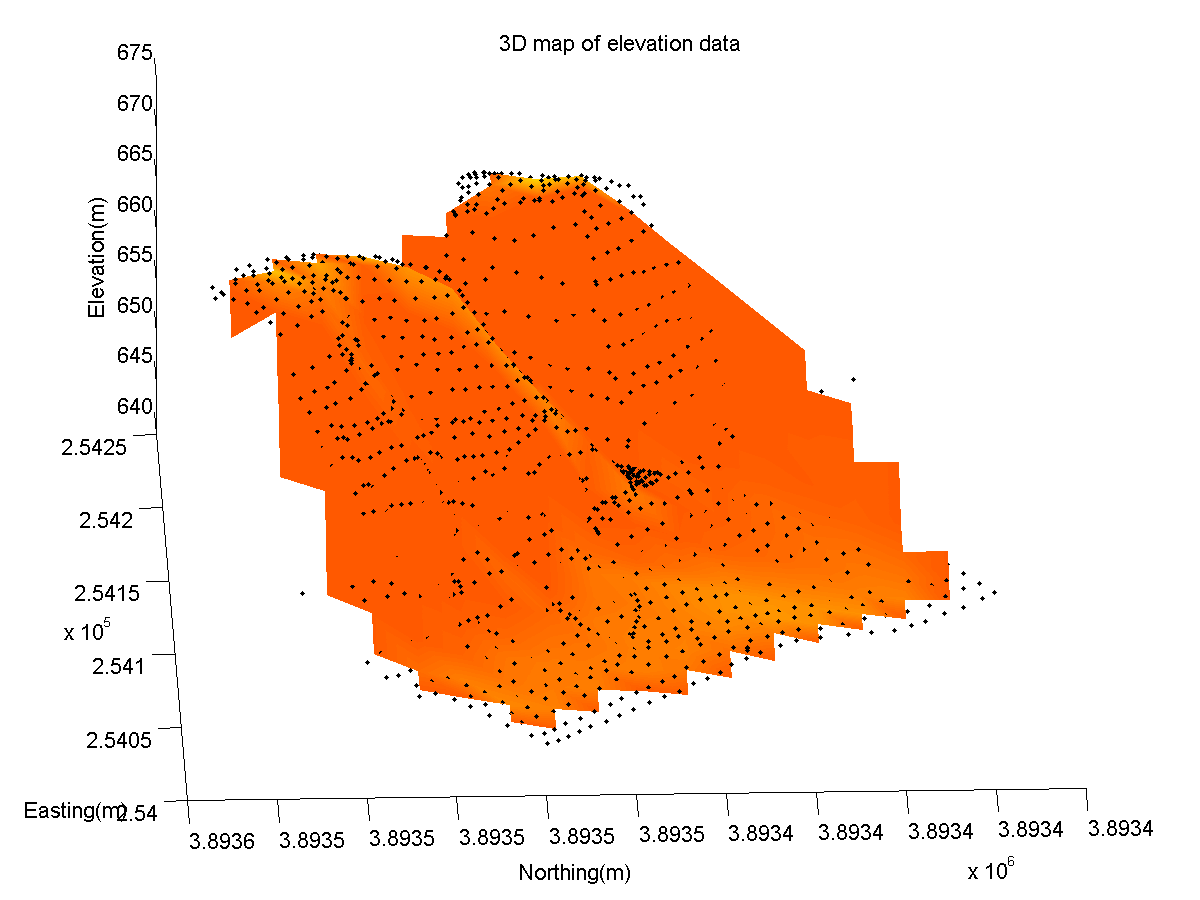
Plots of elevation data for a section of the San Andreas fault
Analysis
There appears to be a short bluff/hill in the north-north-east section of the area. Judging from the density of the measured points along some lines, and a slight dent in the hill-slope, there is an erosional system with one deep channel and at least one shallower one running down the hill to the west of the large gap. There is probably also a channel running out of the large gap.
The most likely location in this area for the line of the San Andreas fault seems to be right at the foot of the hill, as the line of those hills is suspiciously straight. I would place it right around the 655' (light blue) line on the above plots.
There is very little visible evidence in this data for horizontal offset along the fault line. The only point I can come up with is that the dense line of measured points (which I suspect indicates an erosional channel) coming out of the large gap in the hills runs west for about four meters before continuing away from the hills. This could be unrelated to motion along the fault, however, and there are no obvious elevation changes to indicate channels that no longer align.
The data file loaded by MATLAB for the above plots can be found here.
Crustal Thickness and Bulk Composition
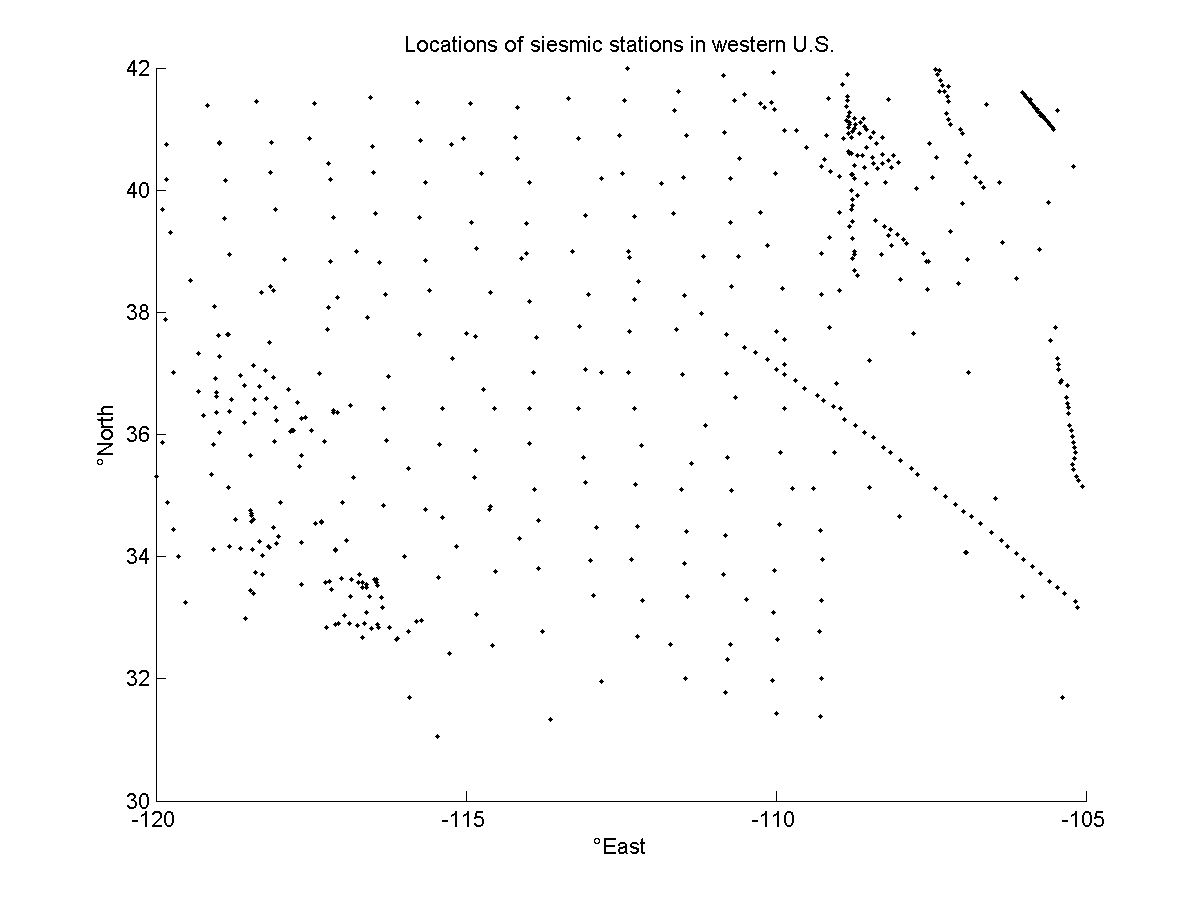
Plots of seismic stations in the Southwest U.S.
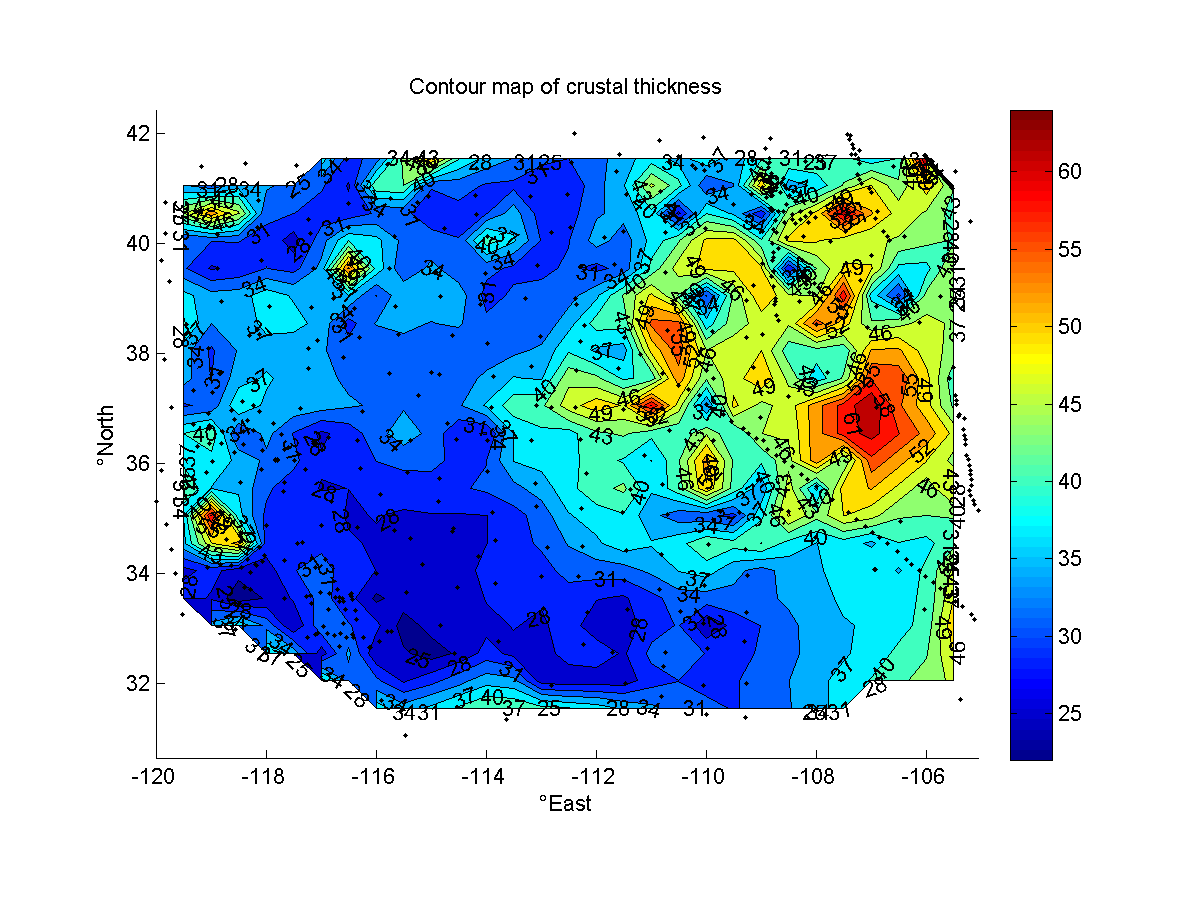
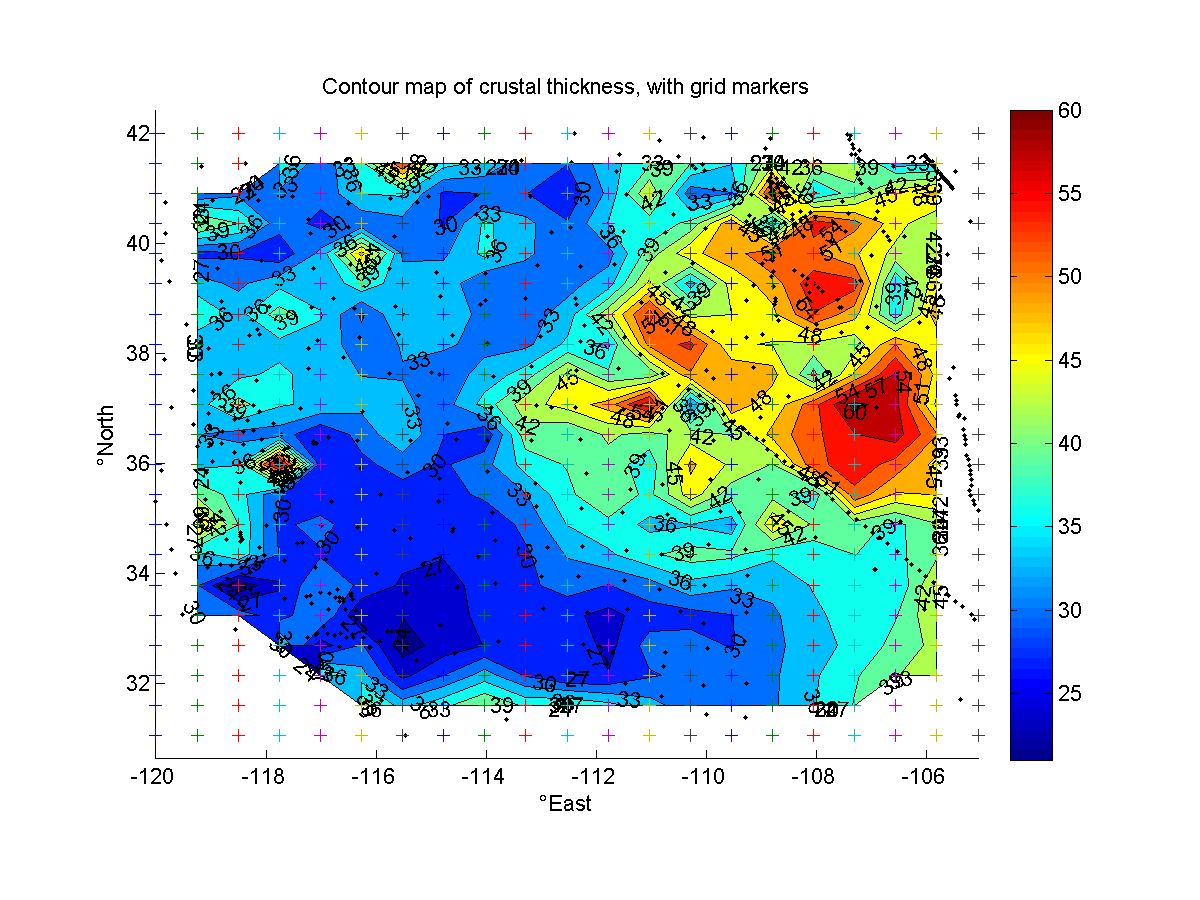
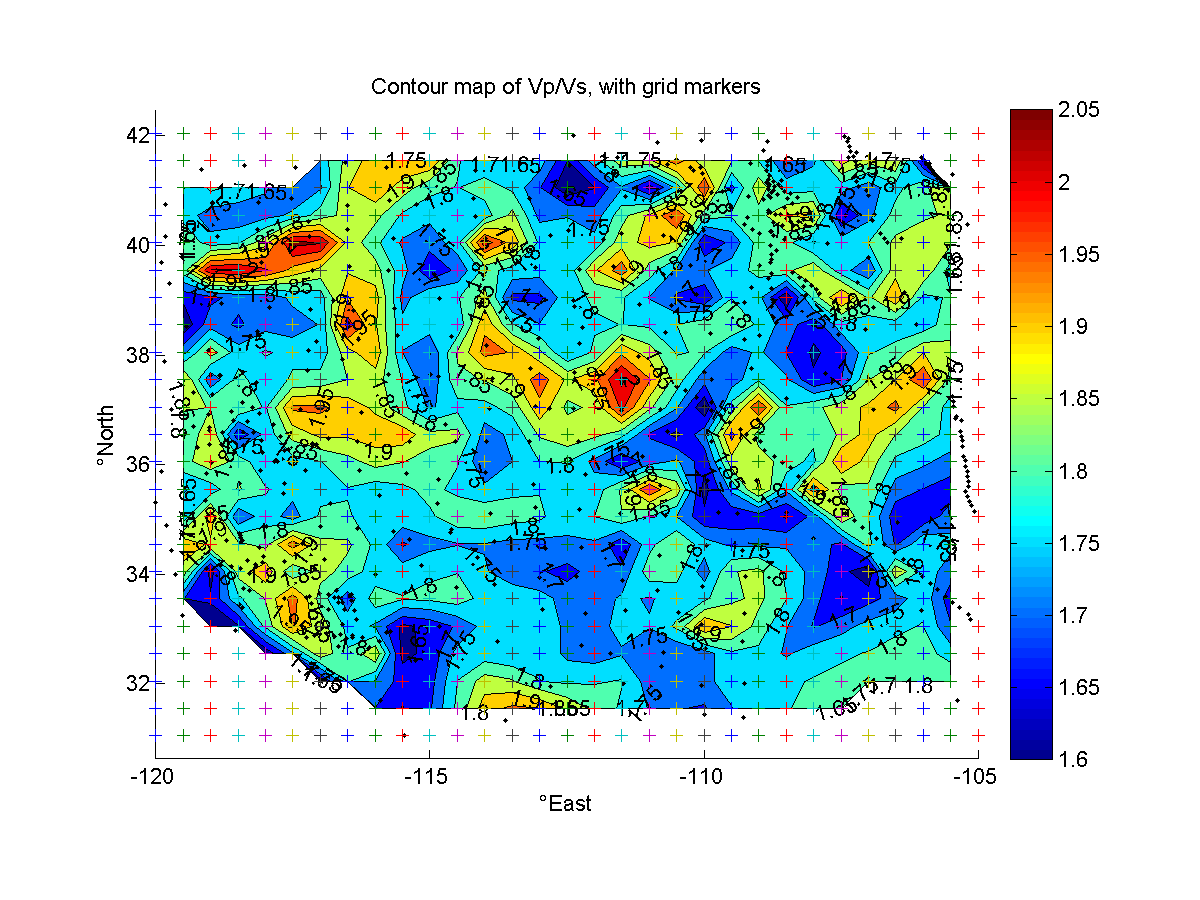
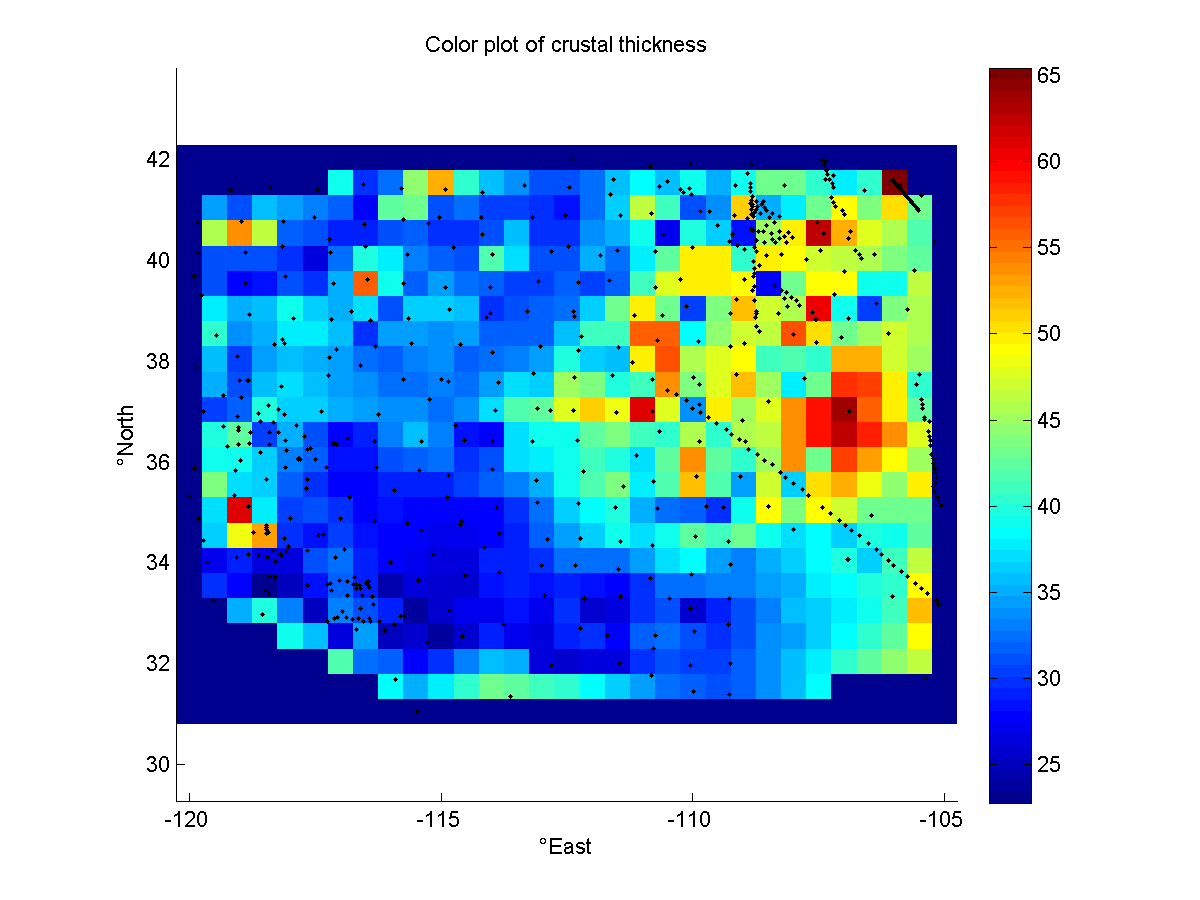
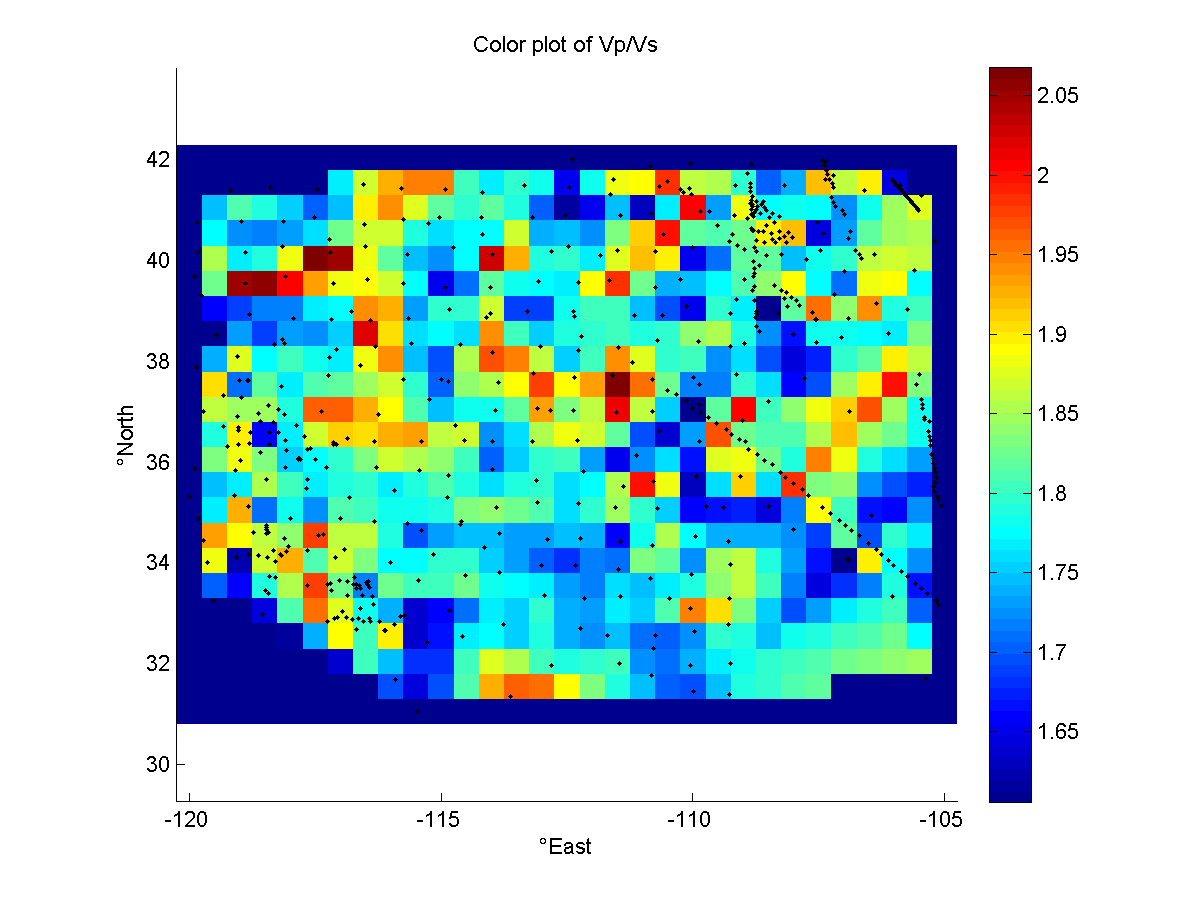
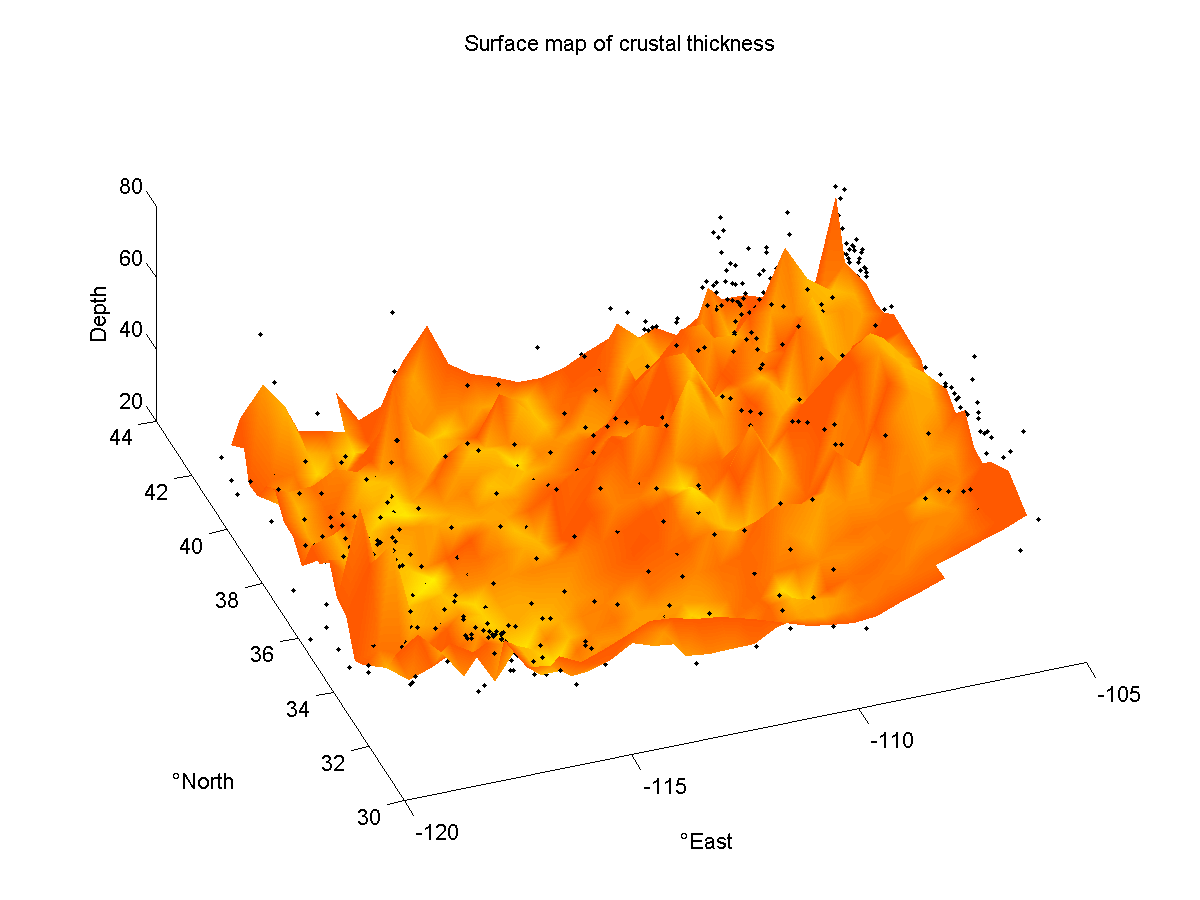
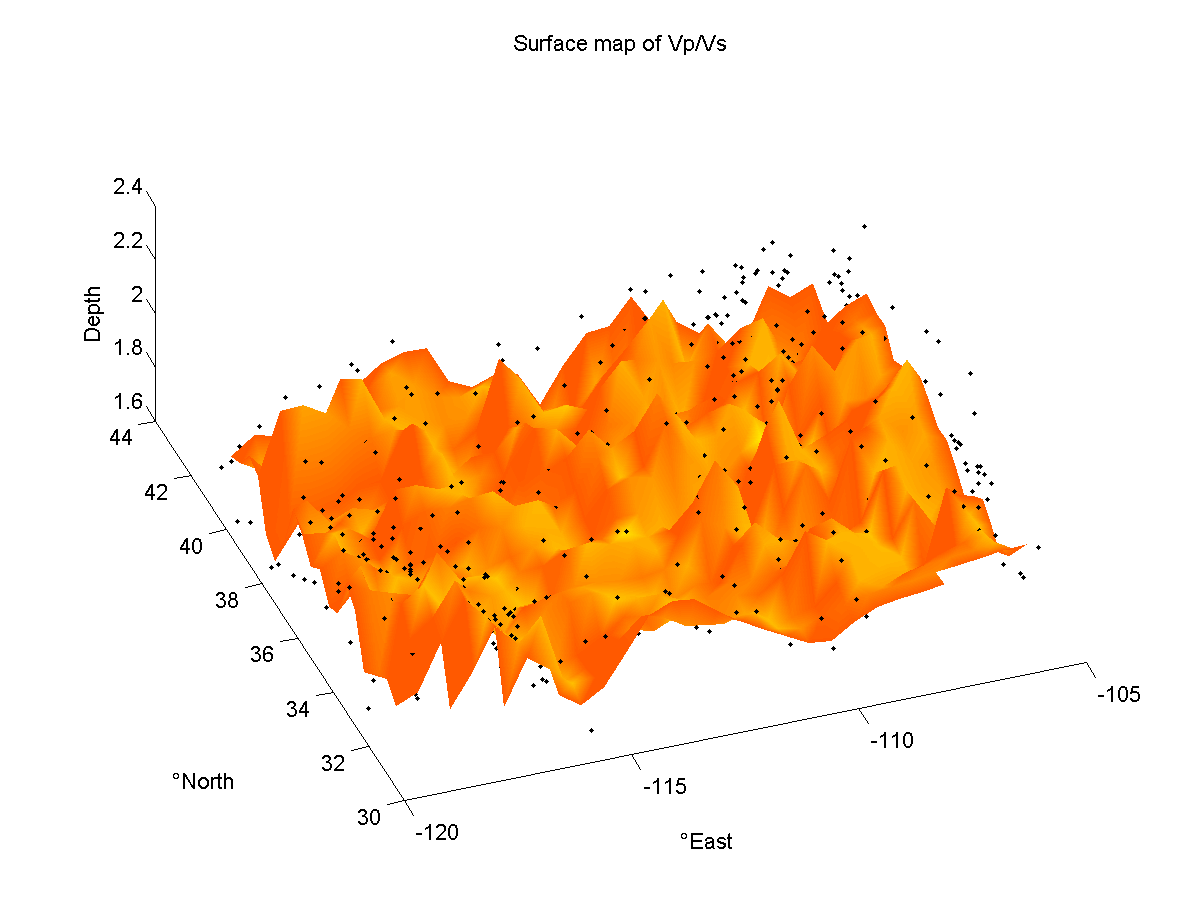
Plots of crustal thickness (left) and vp/vs (right)
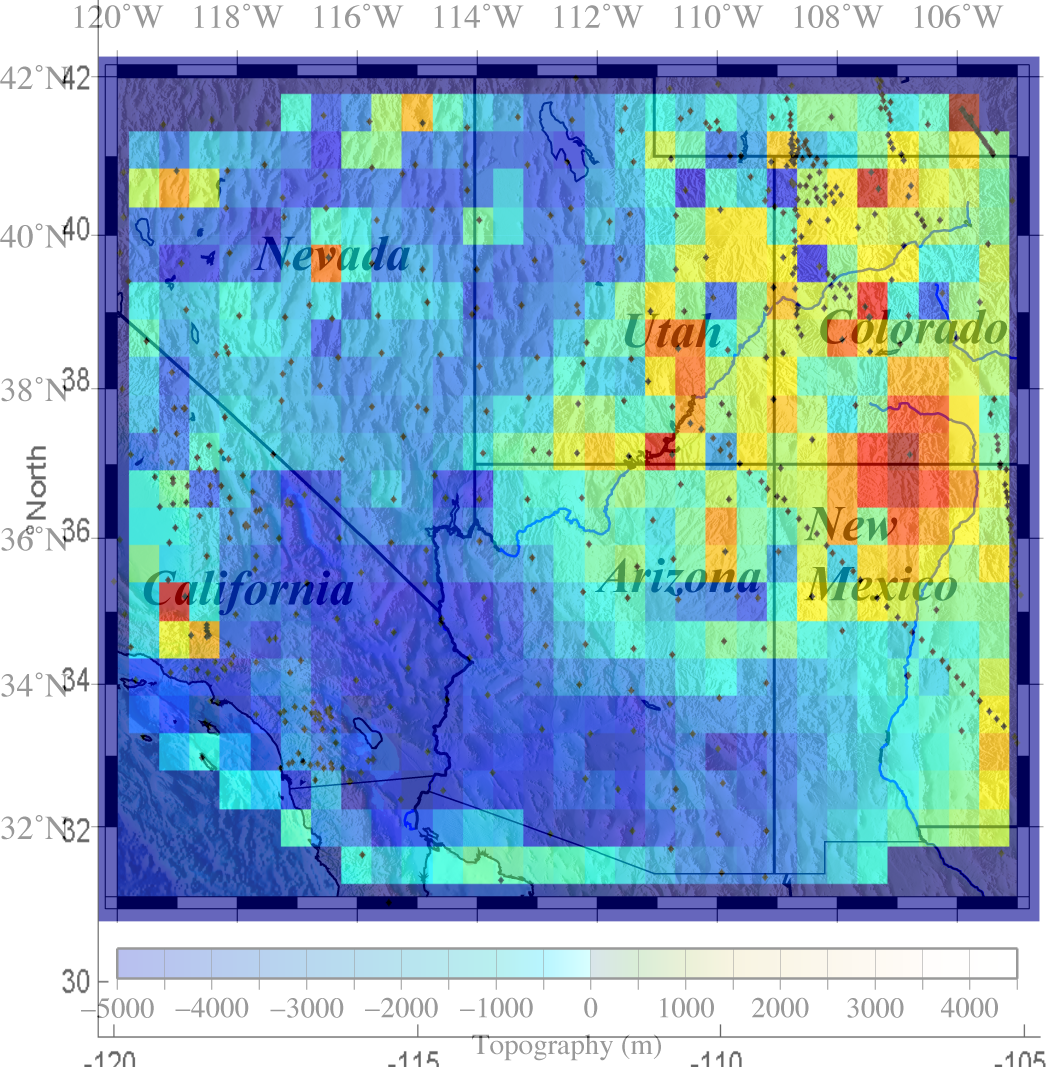
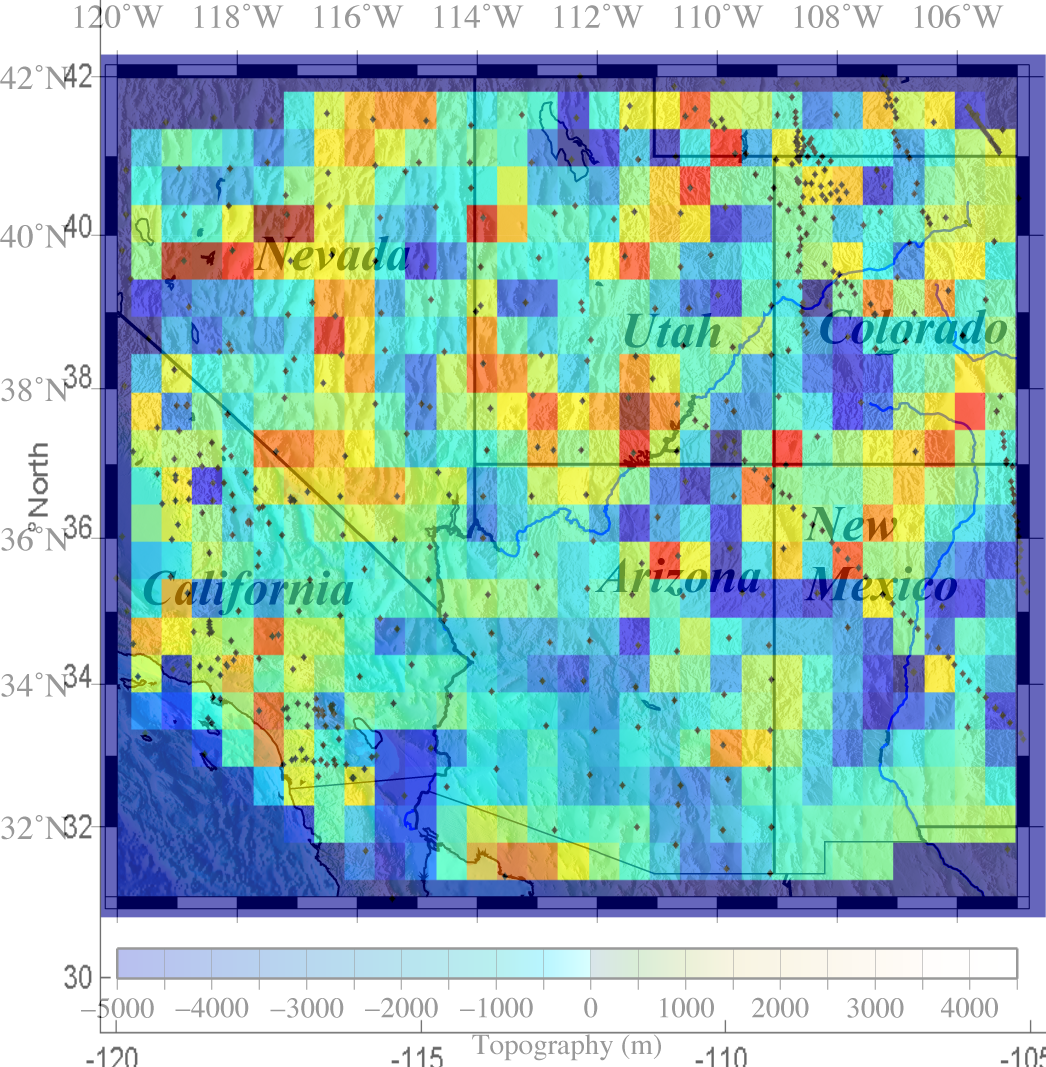
Overlays of thickness and vp/vs on topographic map (approximate)
Crustal thickness versus topography
Vp/vs versus topography
Analysis
The very high peaks of 60km thickness (basically, anything in red) are probably anomalous, as they tend to be sharply defined, and occur only where there was a single data point in a grid box. Nevertheless, the region around the Colorado Plateau is generally fairly thick (45-50km), and there is a region of thin crust (25-30km) running from southern California to south-central Arizona.
The topography correlates fairly well with crustal thickness. The Rocky Mountains are a region of thick crust, the basin in southern California and western Arizona is a region of thin crust, and Nevada's basin-and-range region has average-to-slightly-thick crust.
The vp/vs patterns are much less clearly-defined. There seems to be a band of lower vp/vs (in the 1.75 range) running NW-SE across southern Arizona. There are also some possible bands of higher vp/vs (in the 1.95 range) running along the southwest coast of California, the southerns and western borders of Utah, and the center of Nevada. There is no obvious correlation between vp/vs and crustal thickness.
The data file loaded by MATLAB for the above plots can be found here.
The following scripts were used to read the input data, and called the plotting functions:
Assignment7.m: Handled the San Andreas elevation data.
crustal_depth.m: Handled the crustal thickness data.