The volume of water that passes by a point in a river over a certain
time increment is the discharge (for example, the Tempe Town Lake can apparently
withstand about 40,000 cubic feet per second with the dams up). We quantify
the water flow in the river as Discharge, Q [L3/T].
See figure 3.1 from Knighton and Figure 5.3 (Slope Hydrologic Cycle
from Ritter et al.) for a description of how water gets from precipitation
to the river.
Discharge is related by continuity of water flux at a given channel
cross-section as the product of the velocity times the cross-sectional
area of the flow:
Q = v * A, where Q is discharge [L^3/T], v is velocity [L/T], and A
is area [L^2]
Many channels are effectively rectangular, so we can express the cross-sectional
area as the product of width (w) times depth (d):
A = w * d
where Q = discharge,
A = channel cross-sectional area
v = channel velocity
w = channel width
d = channel depth
For example, the Salt River is about 300 ft wide and about 40
ft deep at the Mill Avenue Bridge and if the velocity is about 30 ft/second
for a fast flood, we get
Q = (300 ft * 40 ft)*30ft/sec = 360,000 ft3/sec for a great
flood there. Measurements of flow velocity and channel shape can
be much more detailed and refine this estimate.
See the quote from Knighton for succint definitions of the two (page 48) and Figure 3.3 from Knighton.
The other difference in how we can describe flow is with regard to two
dimensionless terms:
Reynolds number Re (ratio of driving forces to resisting forces)
and is a measure of turbulence (Re<500 for laminar and Re > 2500 for
fully turbulent.
and
Froude number F ( ratio of inertial forces to gravity) and is
a measure of the relative tranquility or rapidity of the flow (F <1
is subcritical F>1 supercritical flow).
See page 194 from Ritter et al., and Table 3.1 from Knighton for details.
Note the distinctive bedforms that are produced in alluvial channels
as depth and F vary (figure 6.3 from Ritter, et al.)
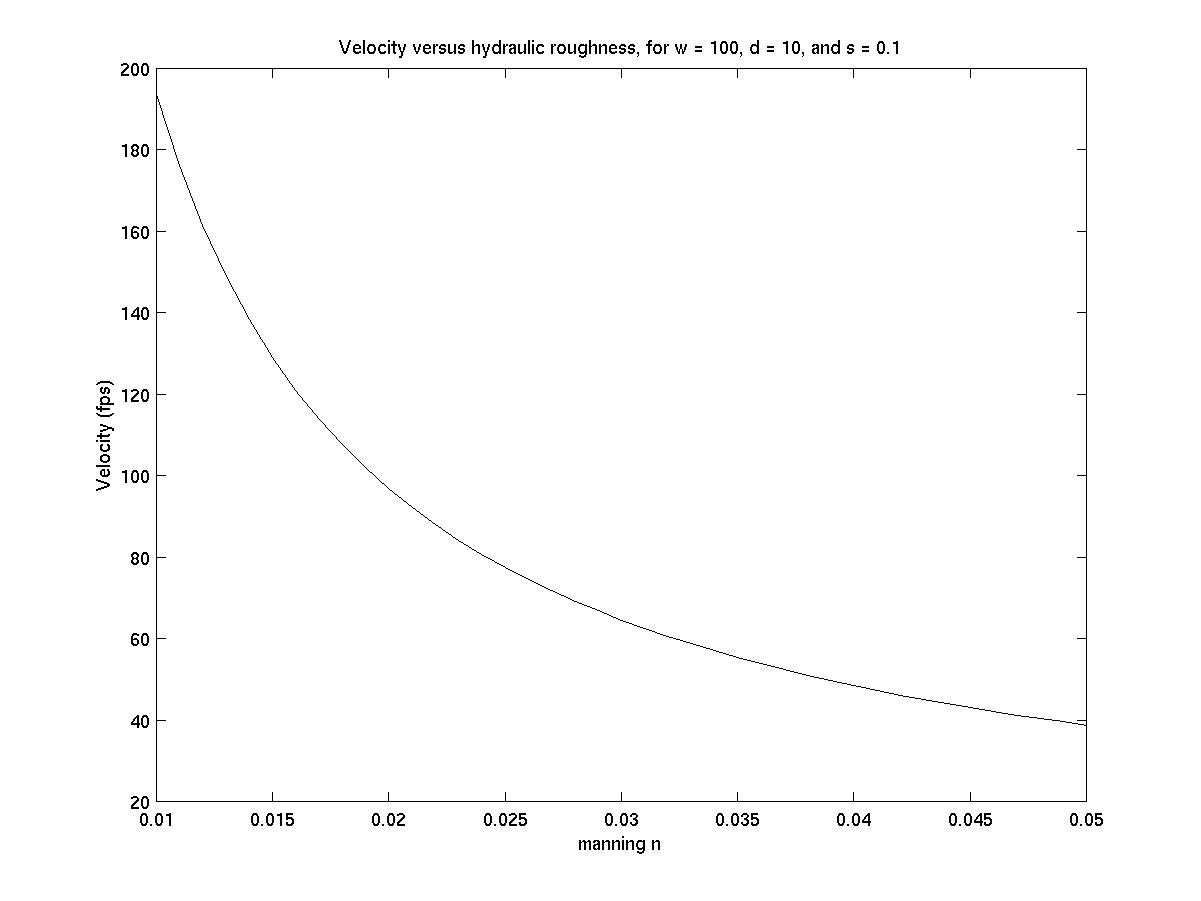
The Manning roughness coefficient (n) is estimated based upon inspection
of the channel and its shape: a
measure of surface roughness depending on the channel boundary type
(see Table 6.1 from Ritter, et al.)
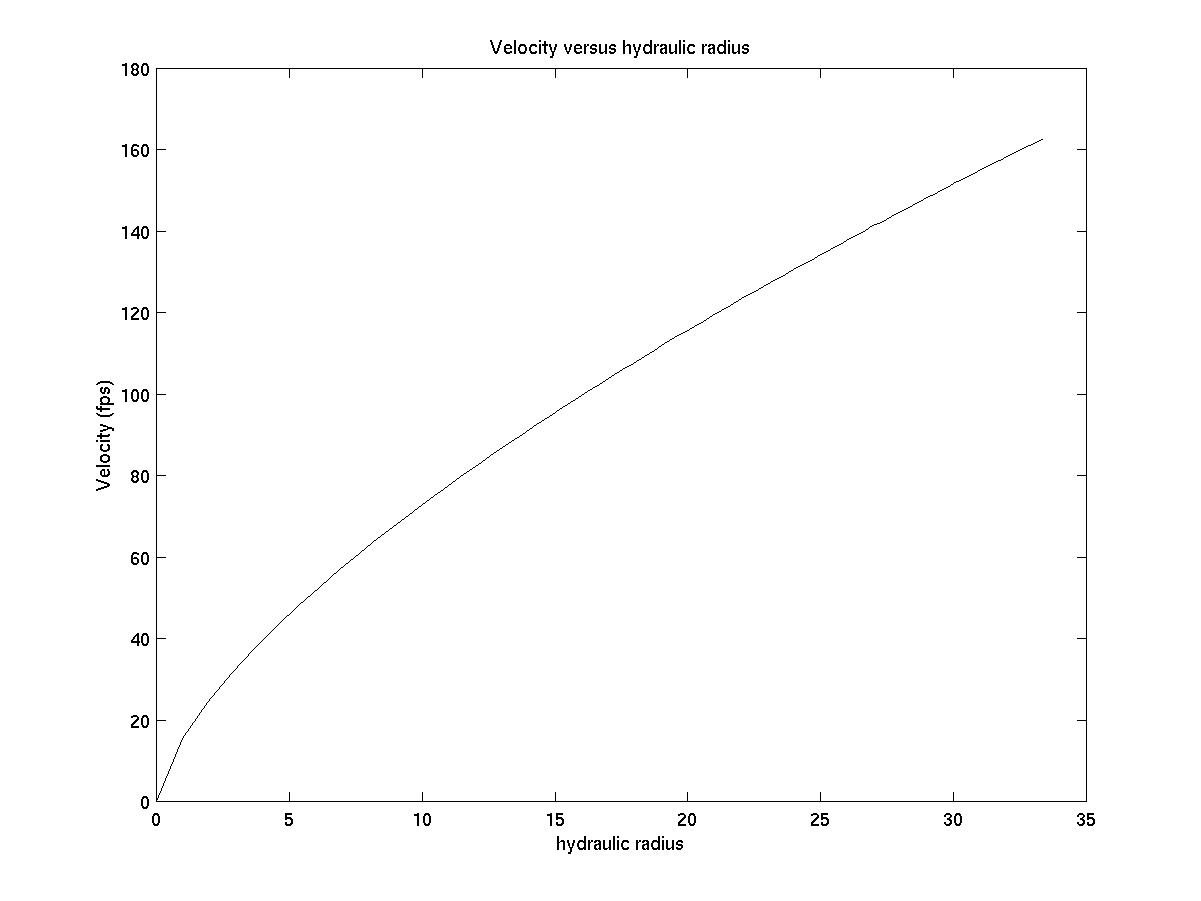
R is the hydraulic radius (see figure 6.2 from Ritter, et al.) The
hydraulic radius R is equal to the ratio of the channel area (A) to its
wetted perimeter (P):
P = w + 2d
R = A/P
and S is the local channel slope.
Here
is a link to another explanation of this problem that I developed for
the Computers in Geology course.
Here
is a link to a matlab function for calculations of velocity using the
manning equation.
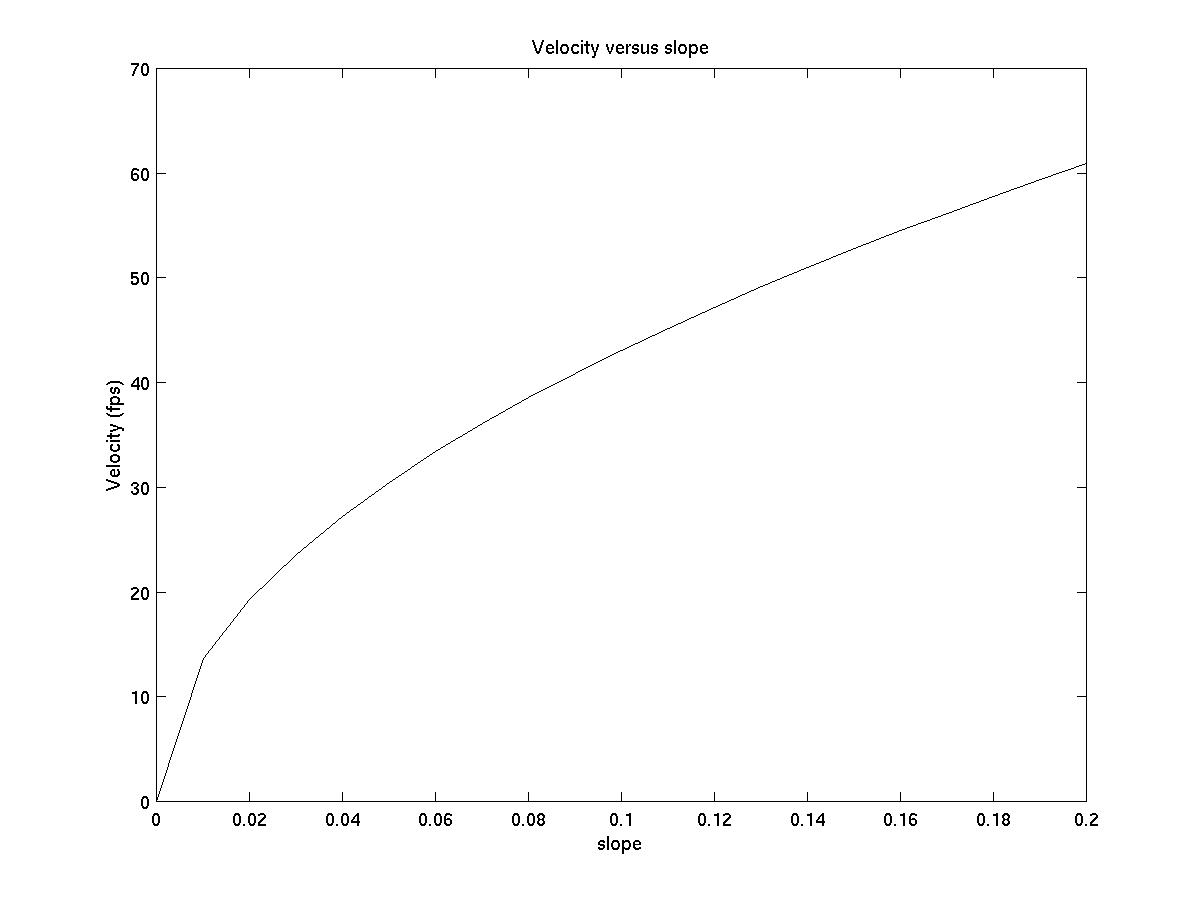
Here is how velocity
varies with n, with
R, and with
slope for a given set of parameters.
The other is Kieffer, S., Graf, J. B., and Schmidt, J. C., 1989, Chapter 3: hydraulics and sediment transport of the Colorado River, in Elston, D. P., Billingsley, G. H., and Young, R. A., Geology of Grand Canyon, northern Arizona (with Colorado River Guides), American Geophysical Union, IGC field trip guide T115/315.
The pool and rapid sequences along many rivers are easily observed and their study can give us insights into the basic concepts of hydraulics and in the development of these impressive river landforms.
See quote from p. 335 (1, Kieffer) and figure 3.1a (Kieffer et al.) on the description of the major features of rapids.
Interpretation of the hydraulics of the rapids is based on the comparison of the rapids with flume studies. See quote on p. 341 (2, Kieffer) about the scale of water flow in the rapids.
Localization of the rapids: "The rapids occur almost exclusively
where floods in tributatry canyons, controlled by local or regional faulting
or jointing, have delivered large boulders into the river channel" p. 345
(Kieffer).
See figures 4 and 5 (Kieffer) for illustrations of the vertical and
horizontal constriction: "...rapids are not formed by sudden drops
in channel bed elevation, but rather are a result of vertical and lateral
constriction" p. 349 (Kieffer).
Reynolds and Froude numbers as useful descriptions of the flow.
Almost all flow in the Grand Canyon is turbulent, but sub and supercritical
flows result in major differences in the character of river flow.
See p. 351(3, Kieffer) for a nice description of the water features
associated with the transition from supercritical to subcritical flow.
Basic rapid structure: Backwaters (pools)-rapids-runouts
Pools are deep and slow velocity basically ponded behind the constriction.
Converging section of rapids is the portion that has accelerating flow
and the transition from sub to supercritical conditions. Flow surface is
smooth and depressed.
Diverging section of rapids is the portion in which the flow decelerates
in hydraulic jumps. The flow goes from super to subcritical and can
be envisioned as a high velocity jet emerginf from a constriction (see
figure 8, Kieffer).
Sediment transport: See Hjulstrom criterion in Figure 13 (Kieffer) and the quote from Kieffer et al. (4)
A model for the geomorphic-hydraulic evolution of the river channel
at debris fans. See figure 17 and final paragraph (5, Kieffer).