Overview
Transactive Energy Service System (TESS), funded by the US Department of Energy (DOE), focuses on evaluating a specific coordination technology known as "Prices-from-Devices Transactive Energy". The technology is designed to assist energy consumers, utilities and policy makers in meeting their energy, financial, and environmental aims. To test its efficiency, this technology will be deployed in three rural communities in New Hampshire and Maine, including in low-income areas. The evaluation will seek to measure its effectiveness in coordinating across grid-interactive and energy efficient buildings.
Advantages of TESS
TESS employs a local, feeder-based electricity market approach to facilitate the operation of Distributed Energy Resources (DERs). In this model, a certain price is calculated based on the bids placed by individual DERs and utilities for buying or selling power during the market interval, with the interval happening every five minutes or less.
Bids from DERs are determined automatically by drawing from user-preferred settings, which can be expressed using a mobile application or a console within the building. Collectively, these bids and the market clearing price determine which DERs consume power from the grid and which ones contribute power back into it during each market interval.
Despite the automation aspect, human involvement remains an option and not a requirement in real-time. In fact, occupants of the building can choose to opt out of participation at any time or modify their preferences previously set.
Project goals
Upgrade TESS to manage diverse energy resources in multiple buildings securely, supporting various market mechanisms and pricing models.
Validate TESS' effectiveness in meeting policy goals, ensuring flexible demand and occupant comfort at reasonable costs.
Develop an open-source tool for utilities and regulators to assess TESS' performance in reducing energy expenses, expediting decarbonization, and improving grid reliability.
Project team


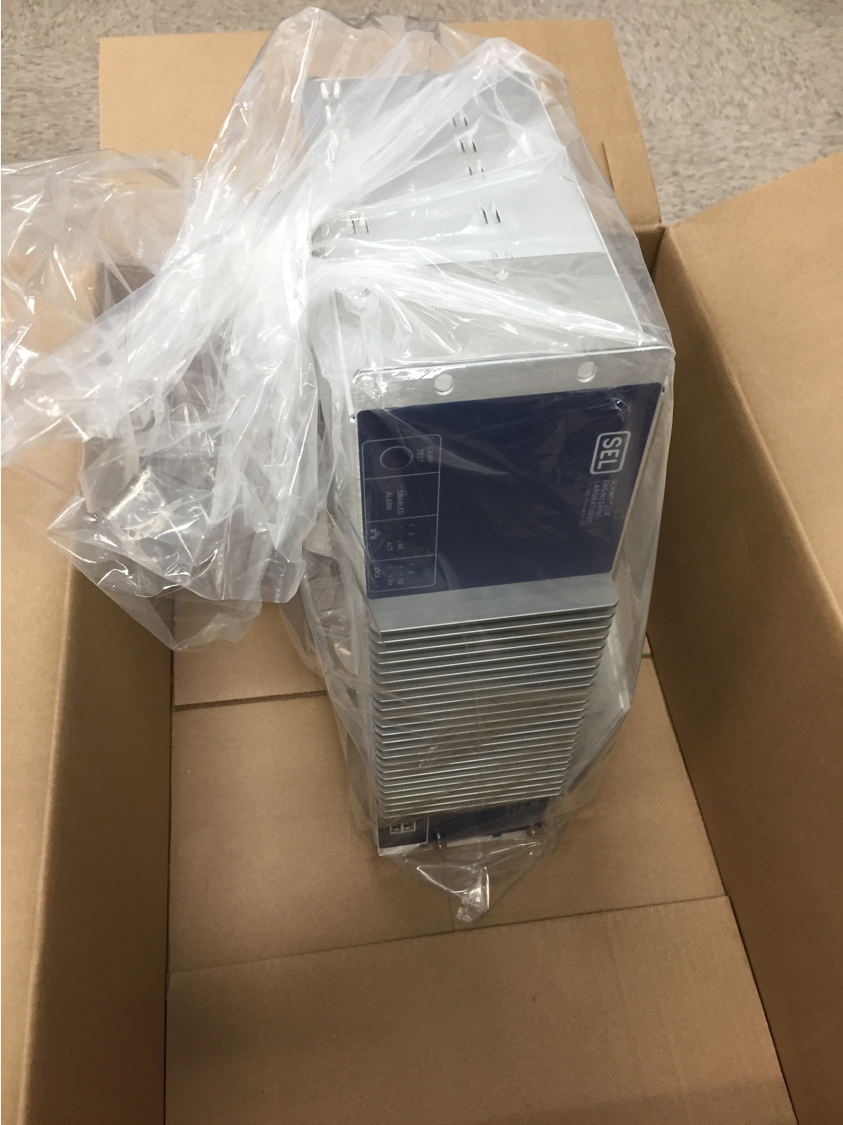
Project Equipments
In our laboratory, we are fortunate to have equipment funded by the company as part of national projects. These tools are operational every day, gathering power-related data within the campus. This data collection is pivotal for our AI-based research, which focuses on areas such as Centralized Defense and Edge Resilience, etc.
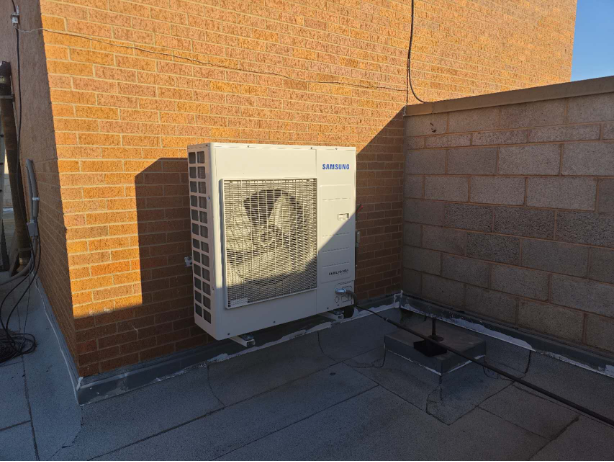
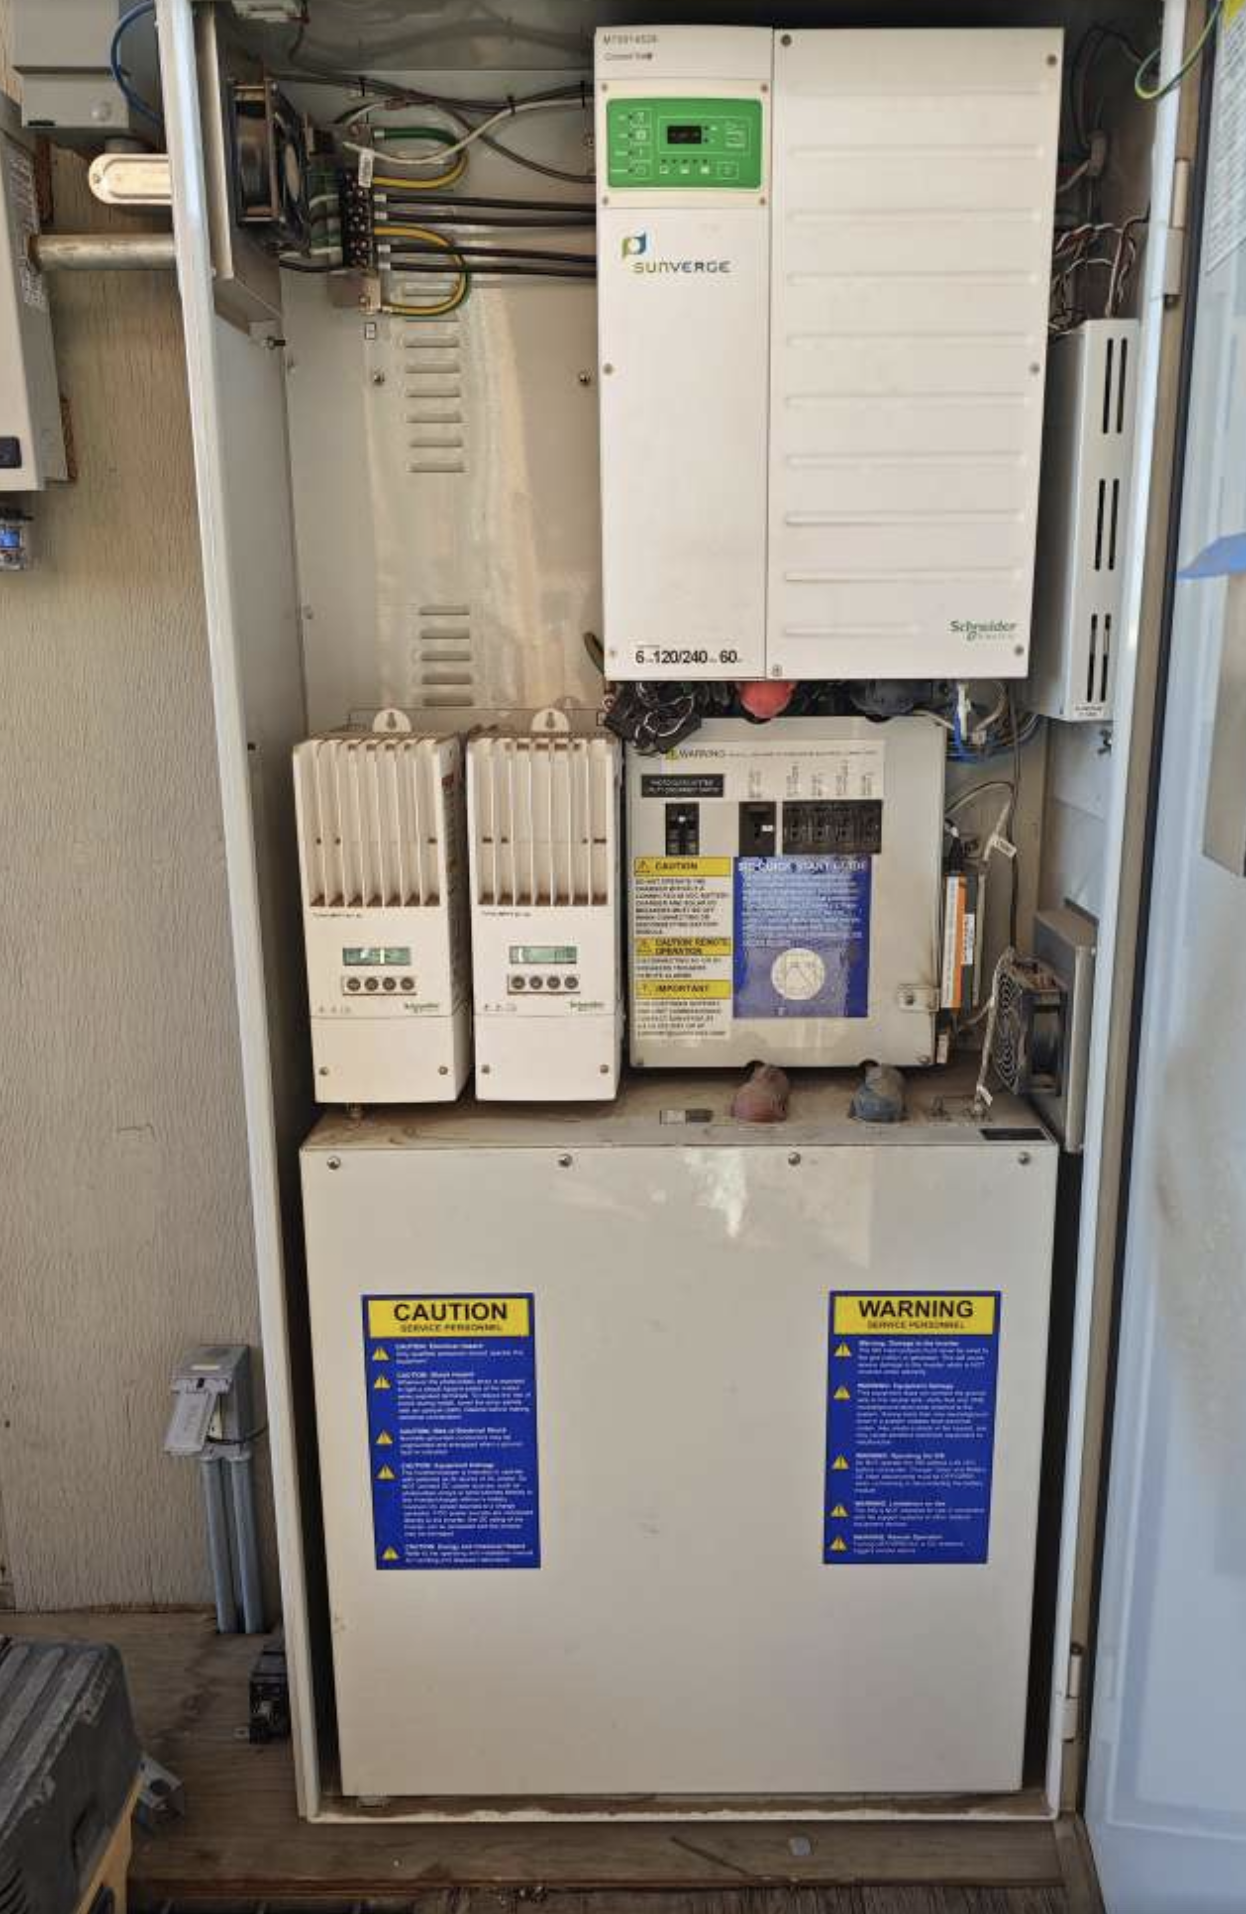
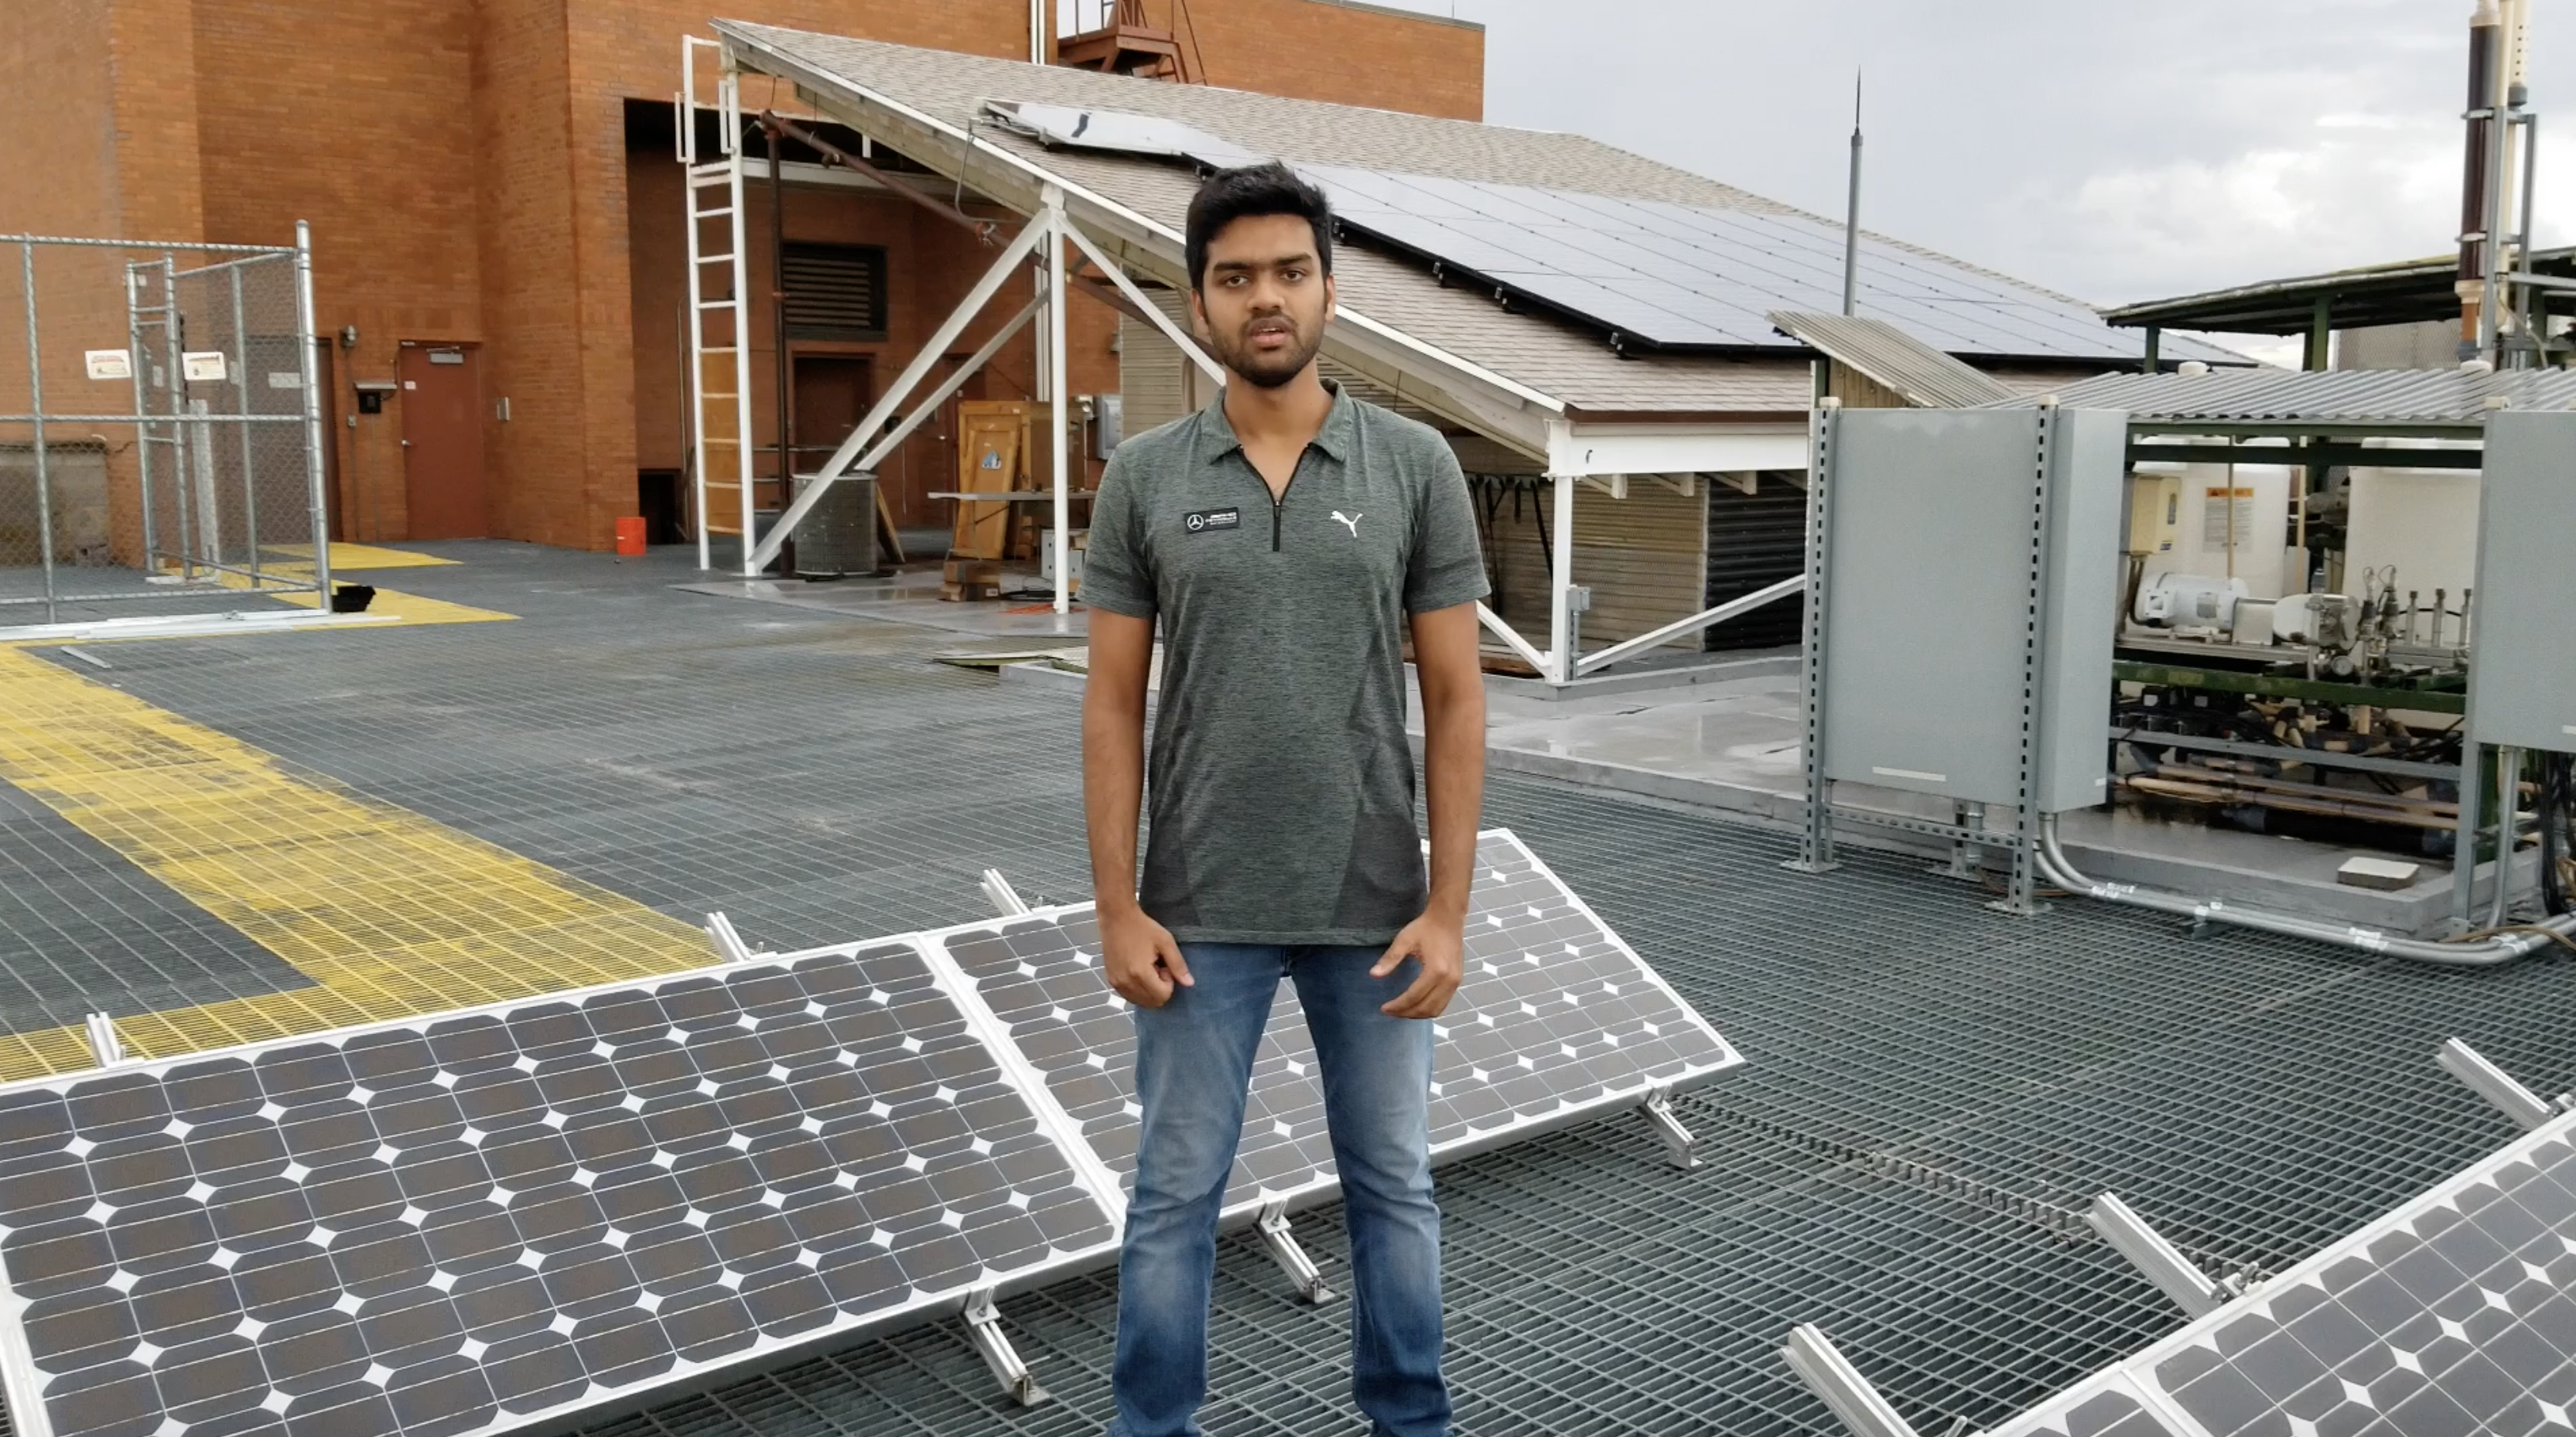
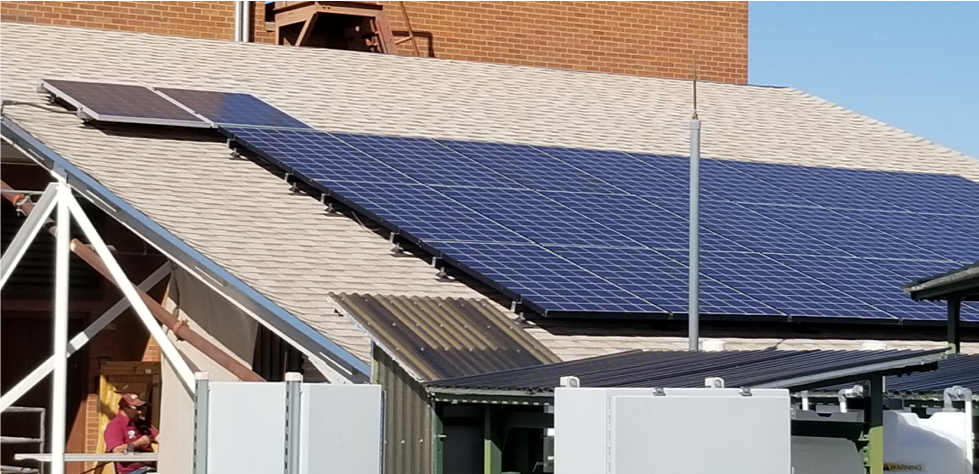
On the roof of the power group building, ASU has a utility interconnected power grid that can generate power for local appliances, storage devices, and send reverse power flow back to a utility partner. We use such a setup and a three-bus transmission grid to emulate problems that can happen in between transmission grids and distribution grids.
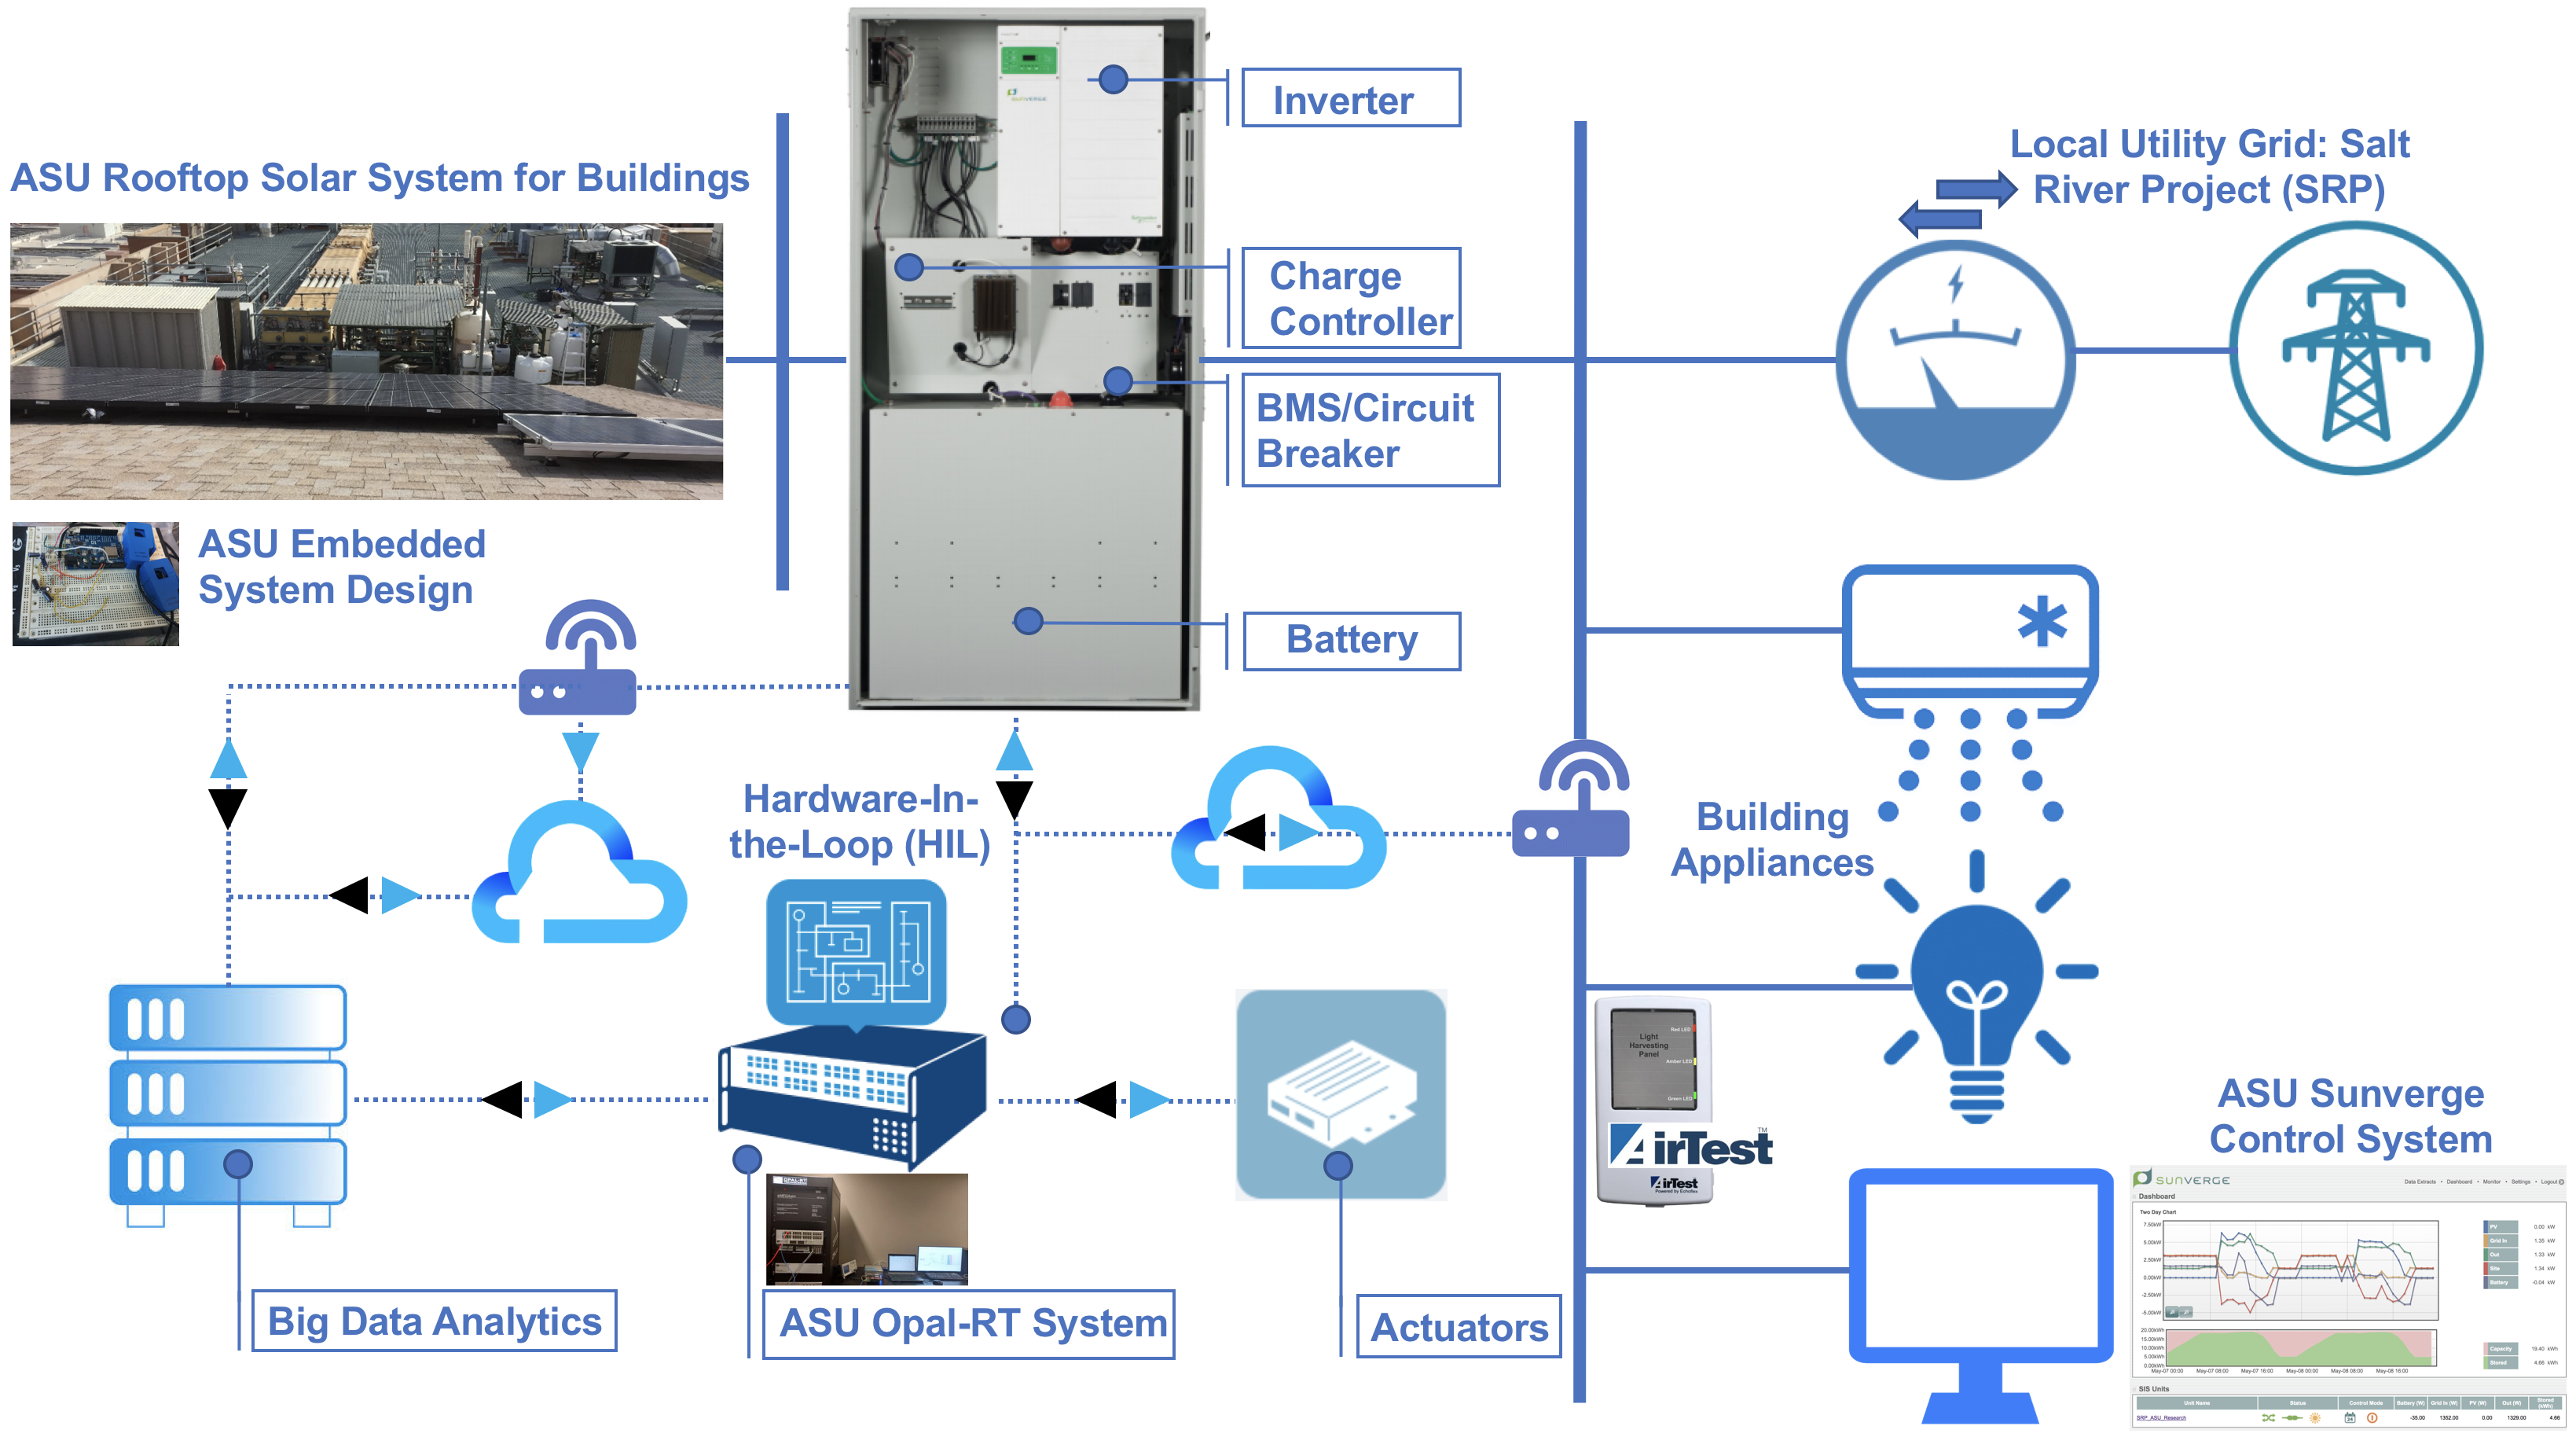
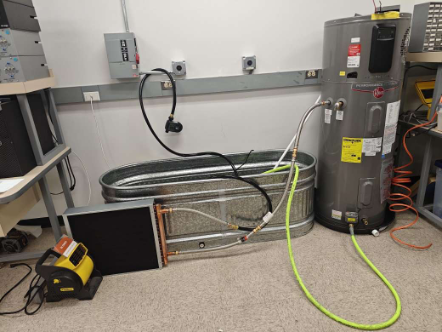
The introduction of multiple renewable microgrids brings more clean energy to meet increasing energy demand. We have a utility connected solar system, providing realistic generation to the grid, to the battery, and to the appliance. The scope is to create different modes for (1) battery control, (2) demand response, (3) islanding, and (4) distribution grid tests.
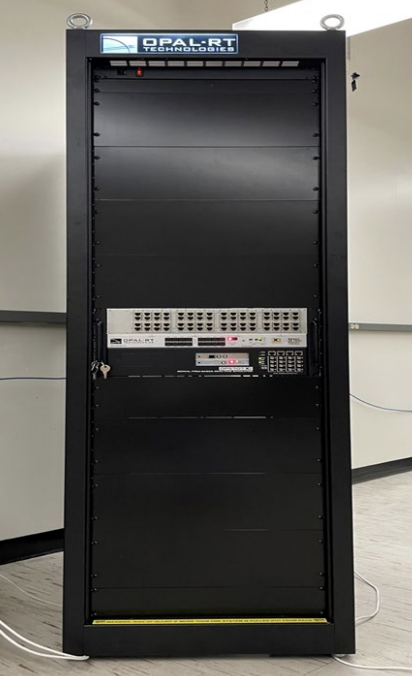
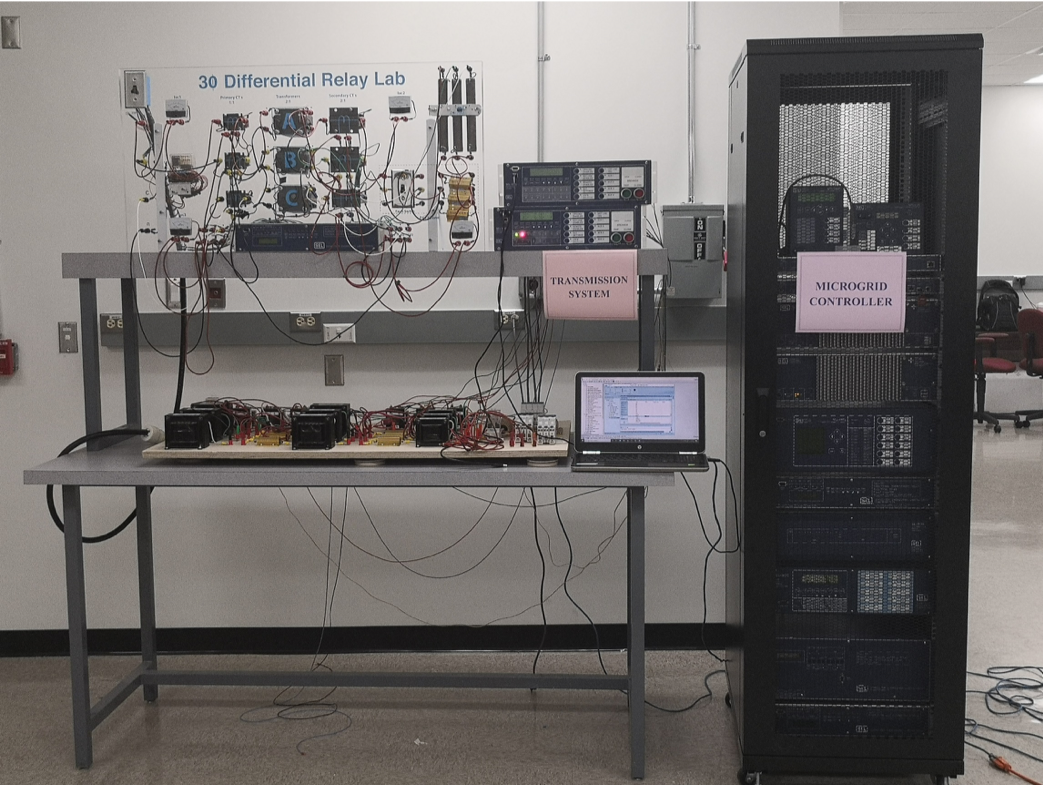
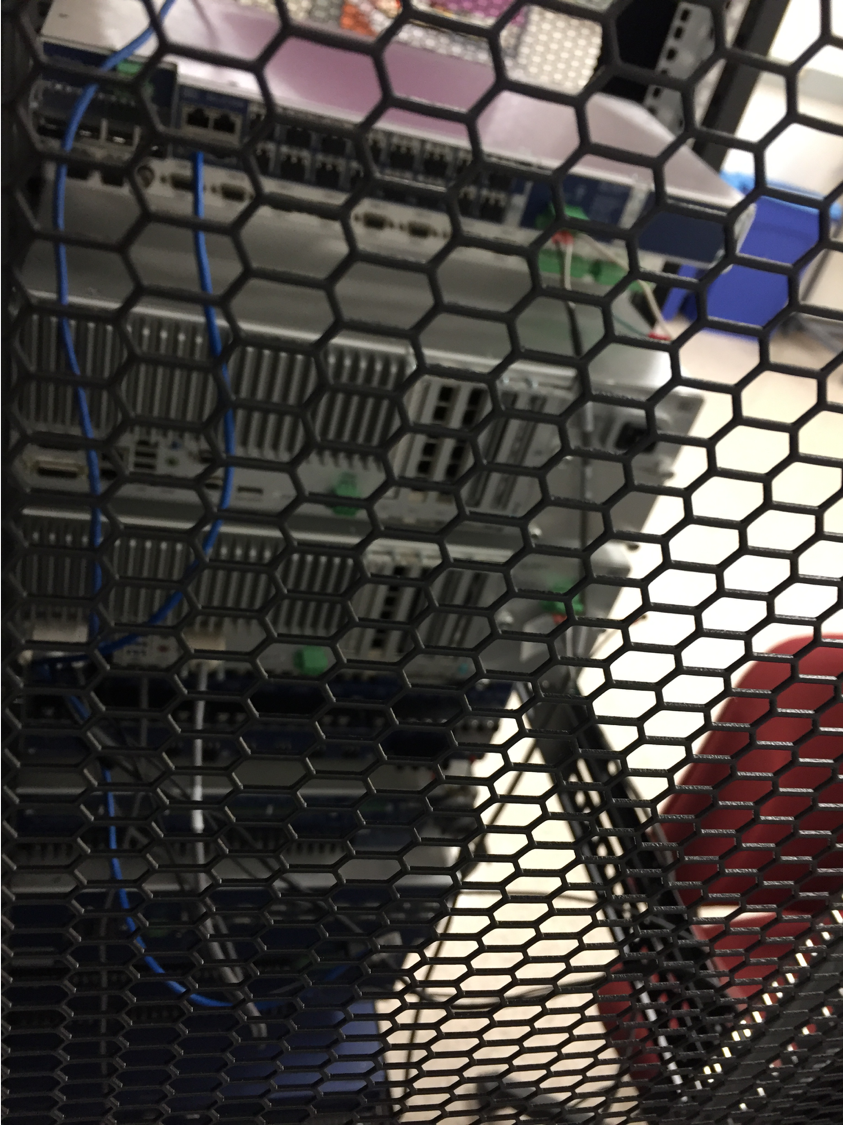
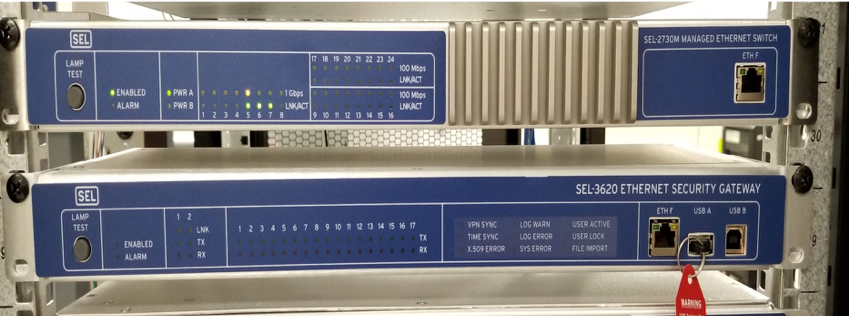
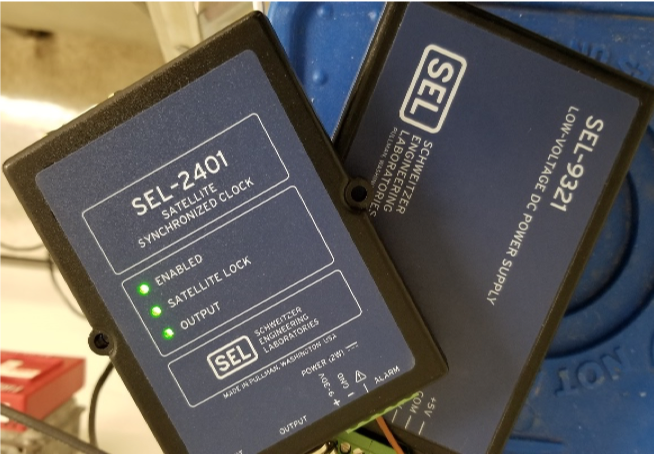
More distributed generation facilities mean bulk bidirectional power flow and more complex network requires more efficient real-time monitoring, control, and protection system to deal with islanding secure and robust interfacing of intelligent electronic devices with the RTAC.
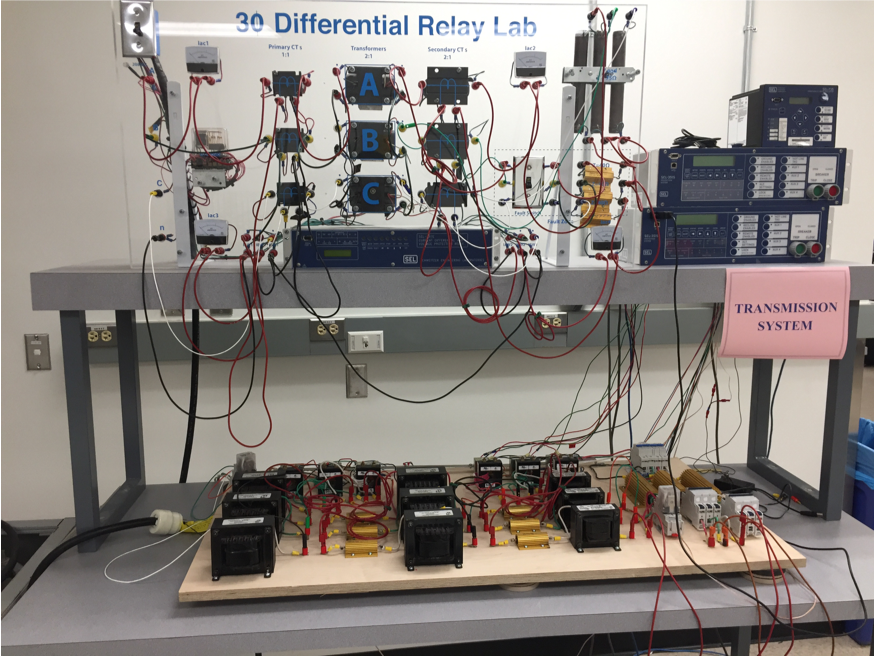
The protection system consists of four parts: distribution lines, faults, two sources including feeding from the network and a 3 phase autotransformer respectively, and two digital protection systems consisting with digital relays, current transformers, potential transformers, and magnetic circuit breakers.
Guidance of ASU Protection System: Download
ASU PDC Manual: Download
ASU RTAC Manual: Download
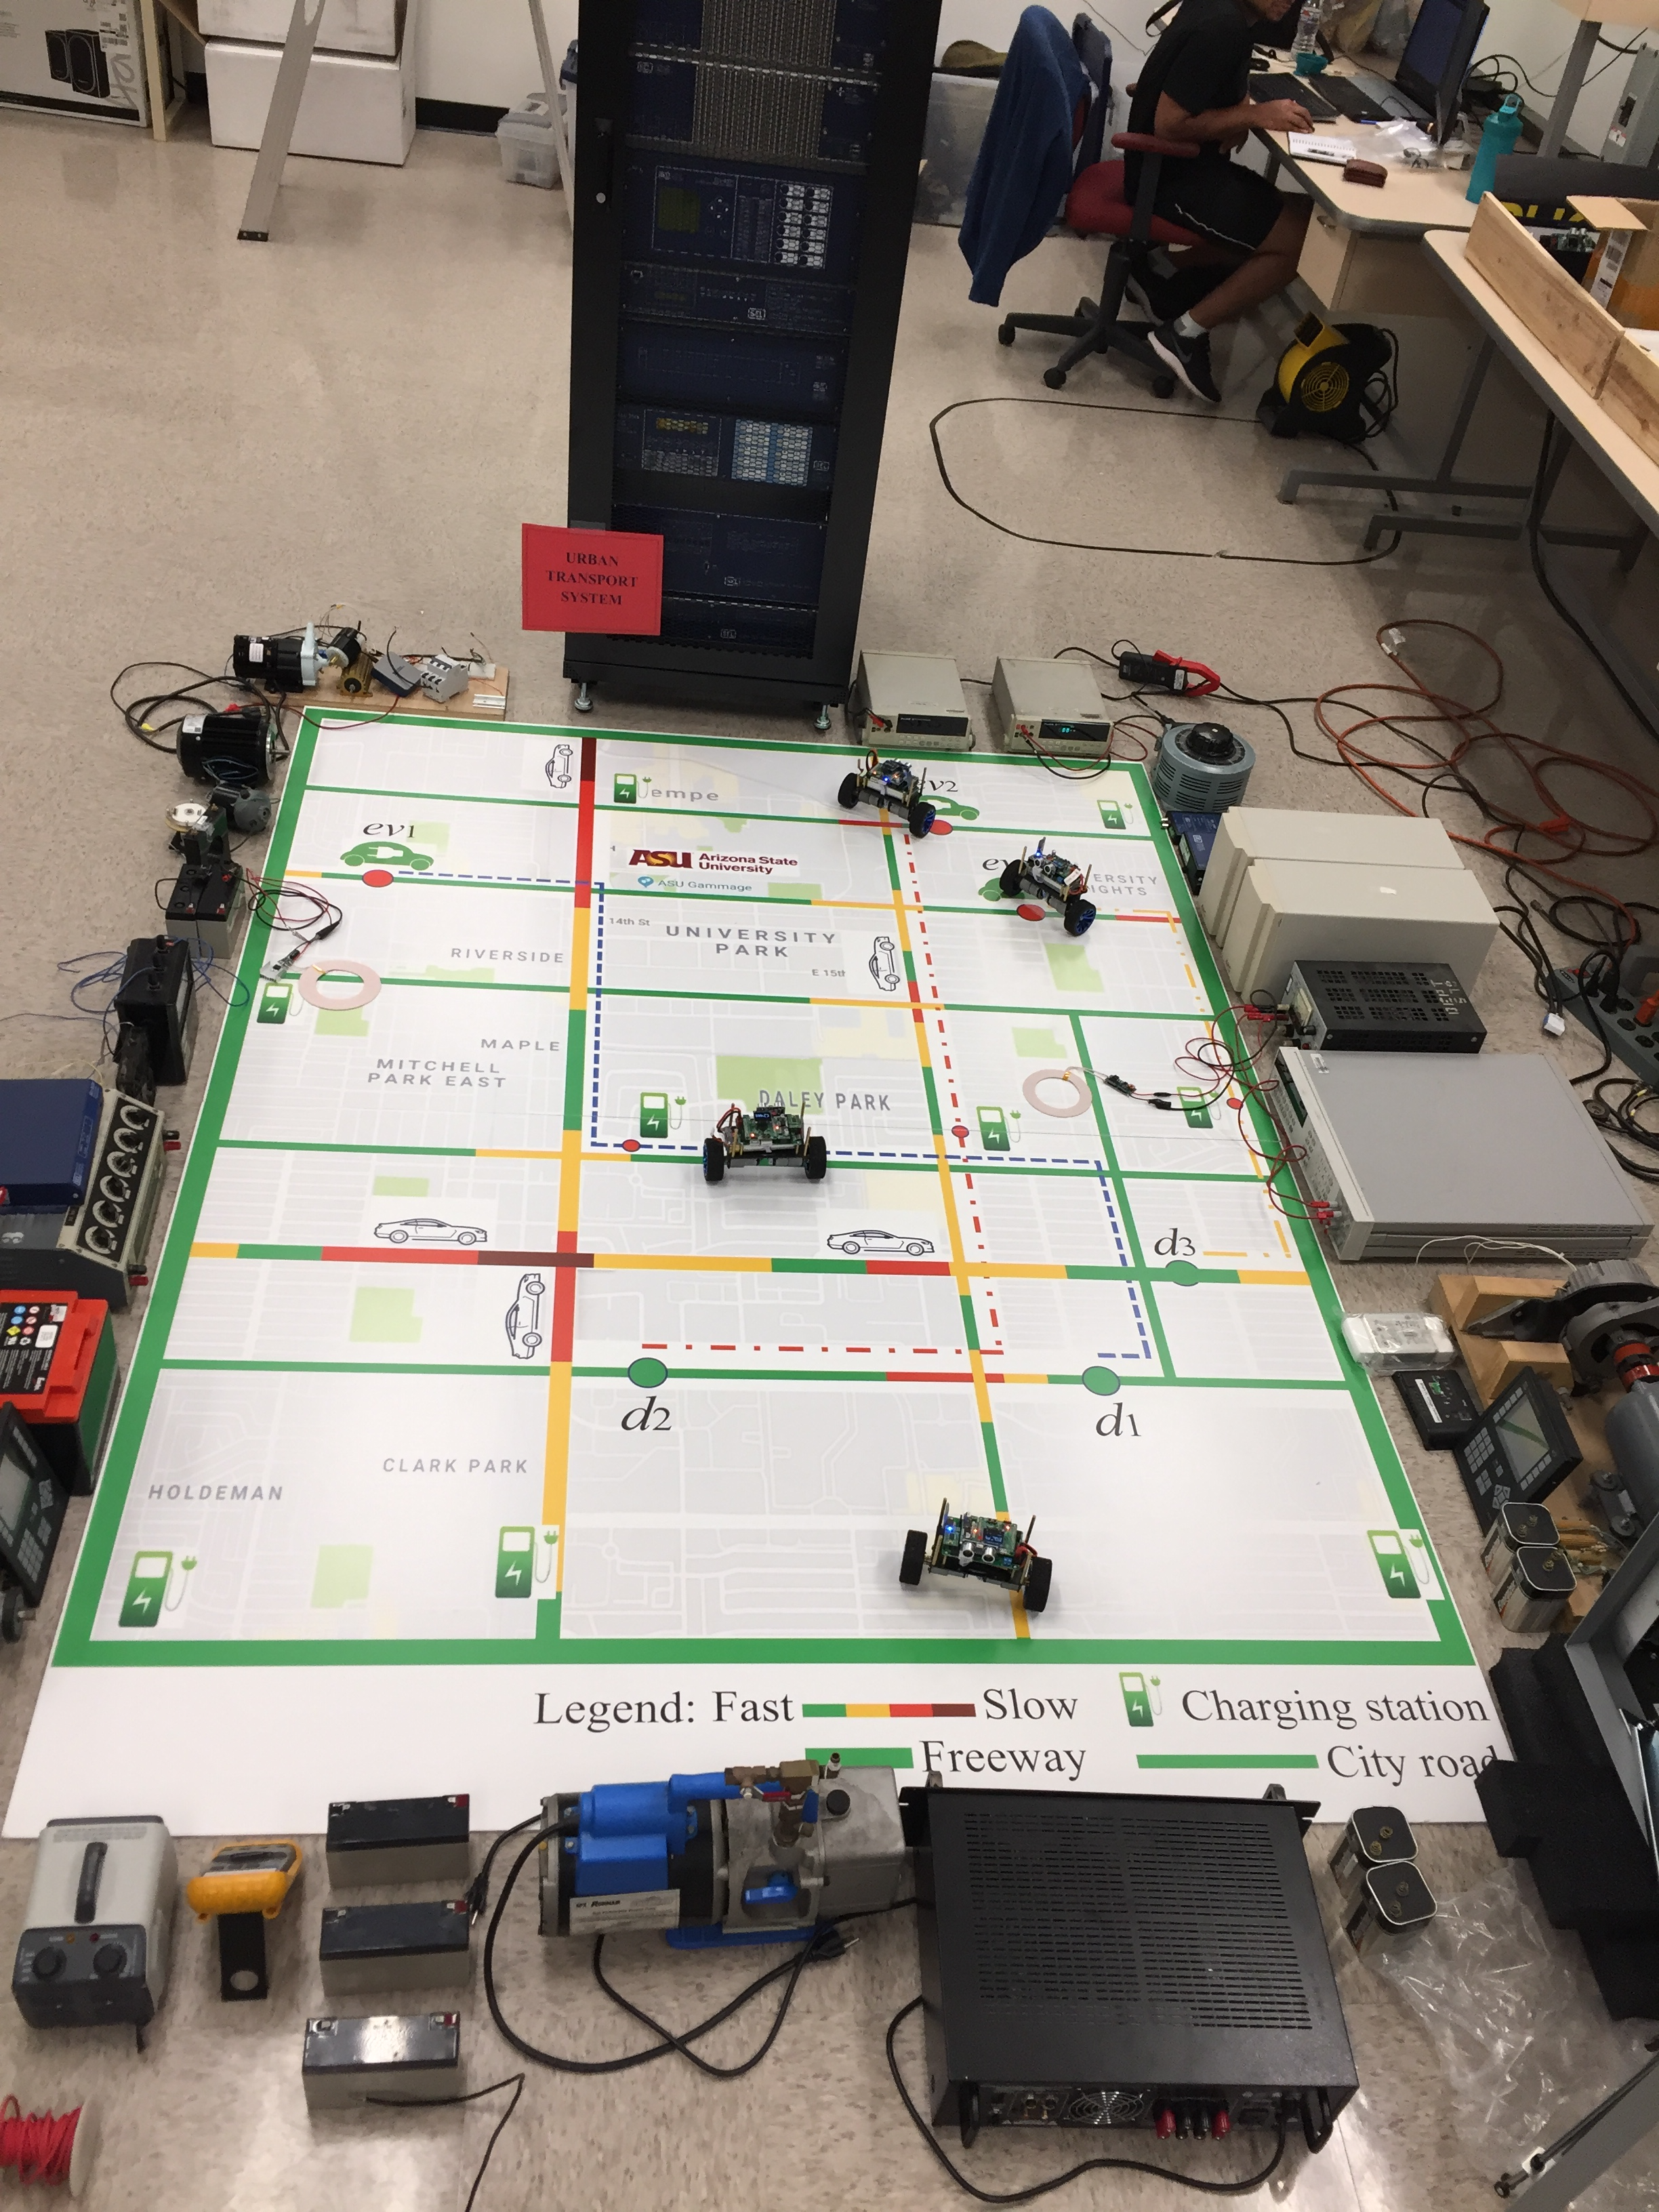
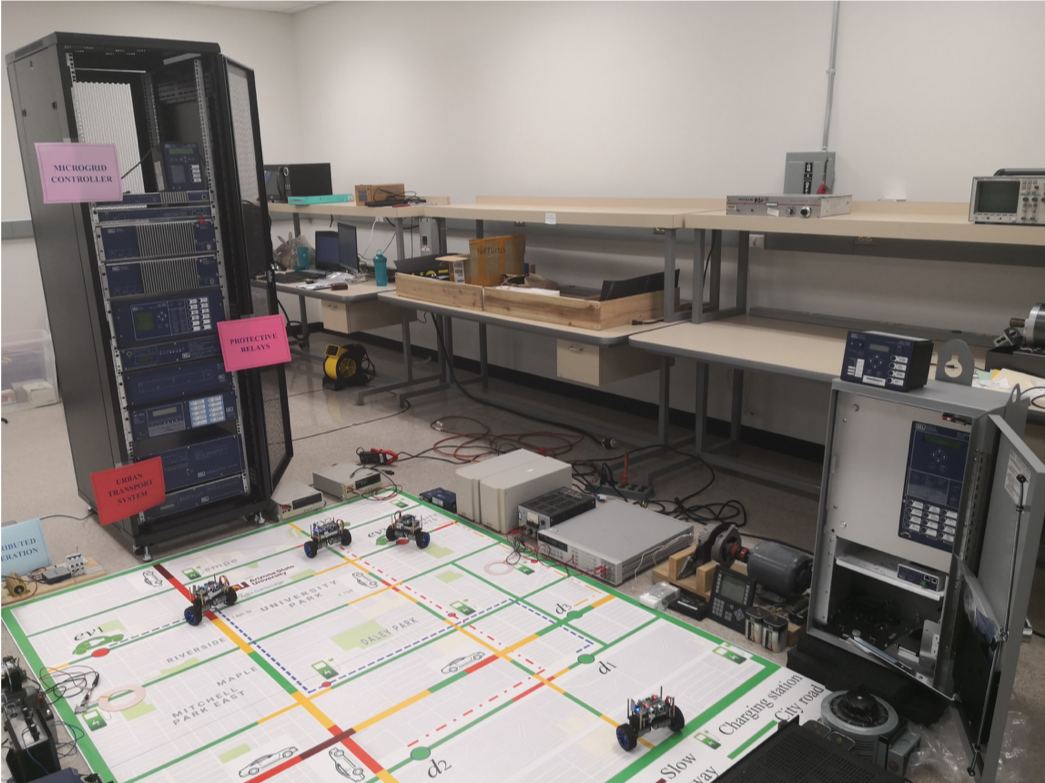
Our group also aims at understanding the interaction between the static electric power grids and dynamic transportation system. The following shows a setup with AI-based robert for interacting with each other for resources and interacting with the grids for better grid regulations.
The followings are some pictures of the software monitoring and control in the lab.
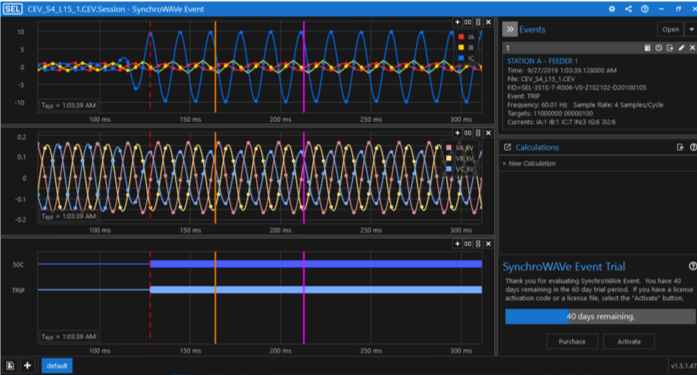
The first image shows the line to ground fault that has been created on the transmission line. The relay displays exactly which phase has tripped and also the LED for the same lights up. The event gets logged in the relay and can be downloaded for further analysis using Synchrowave event software. This picture shows the variation in current and voltage levels after a fault has been created on phase-C. It also displays the exact time when the event occurred.
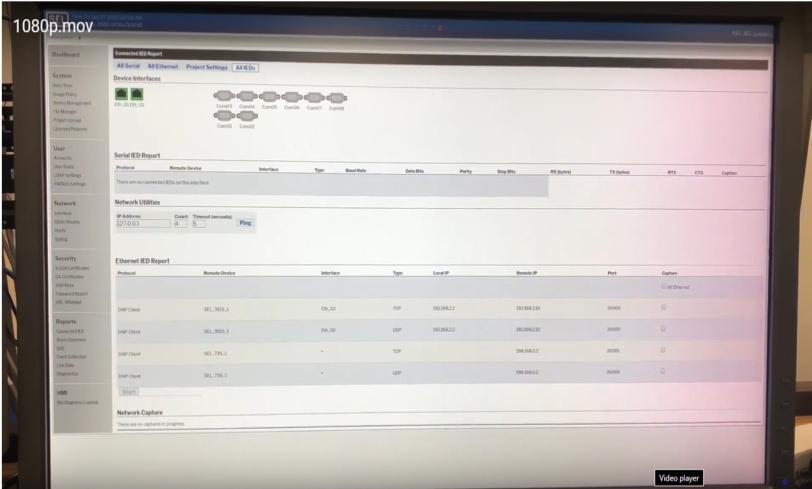
The second image shows the dashboard of acselerator in RTAC software. This dashboard gives a pictorial representation of different devices that have been connected to the different ports of RTAC, the protocol which has been used to interface the devices and the data exchange rate for the packets. It also gives the IP address of the device if we want to change the configuration.
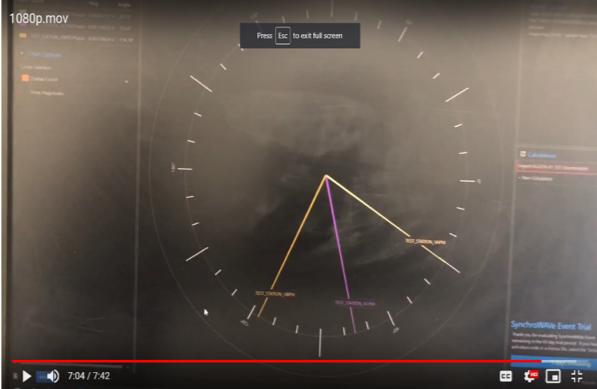
The third represents the time stamped PMU data that has been acquired from the PMU SEL 351S and logged in the Phasor Data Concentrator. In this image we have just chosen three components for phase currents. We can add as many components for our analysis as needed. The software can be programmed to compute different parameters by writing appropriate formulae such as active power, reactive power, etc.
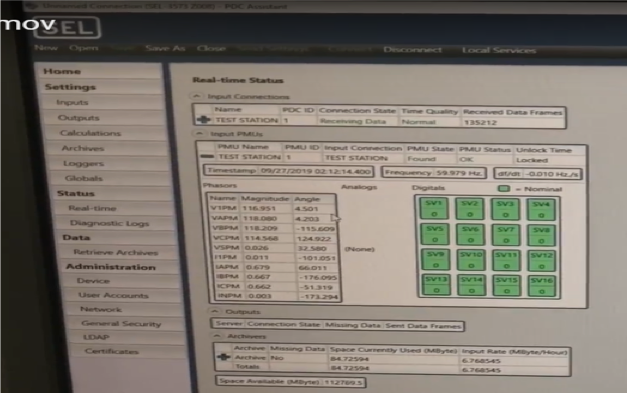
The last image is the PDC Assistant software tool. It gives real-time data acquired by PMU and that is then logged in the Phasor Data Concentrator. This dashboard also represents the status of PMU and the rate at which it exchanges data. You can also manipulate the time zones through this dashboard. The default is UTC. The other parameters displayed on this dashboard are various phasors such as voltages and currents, frequency.
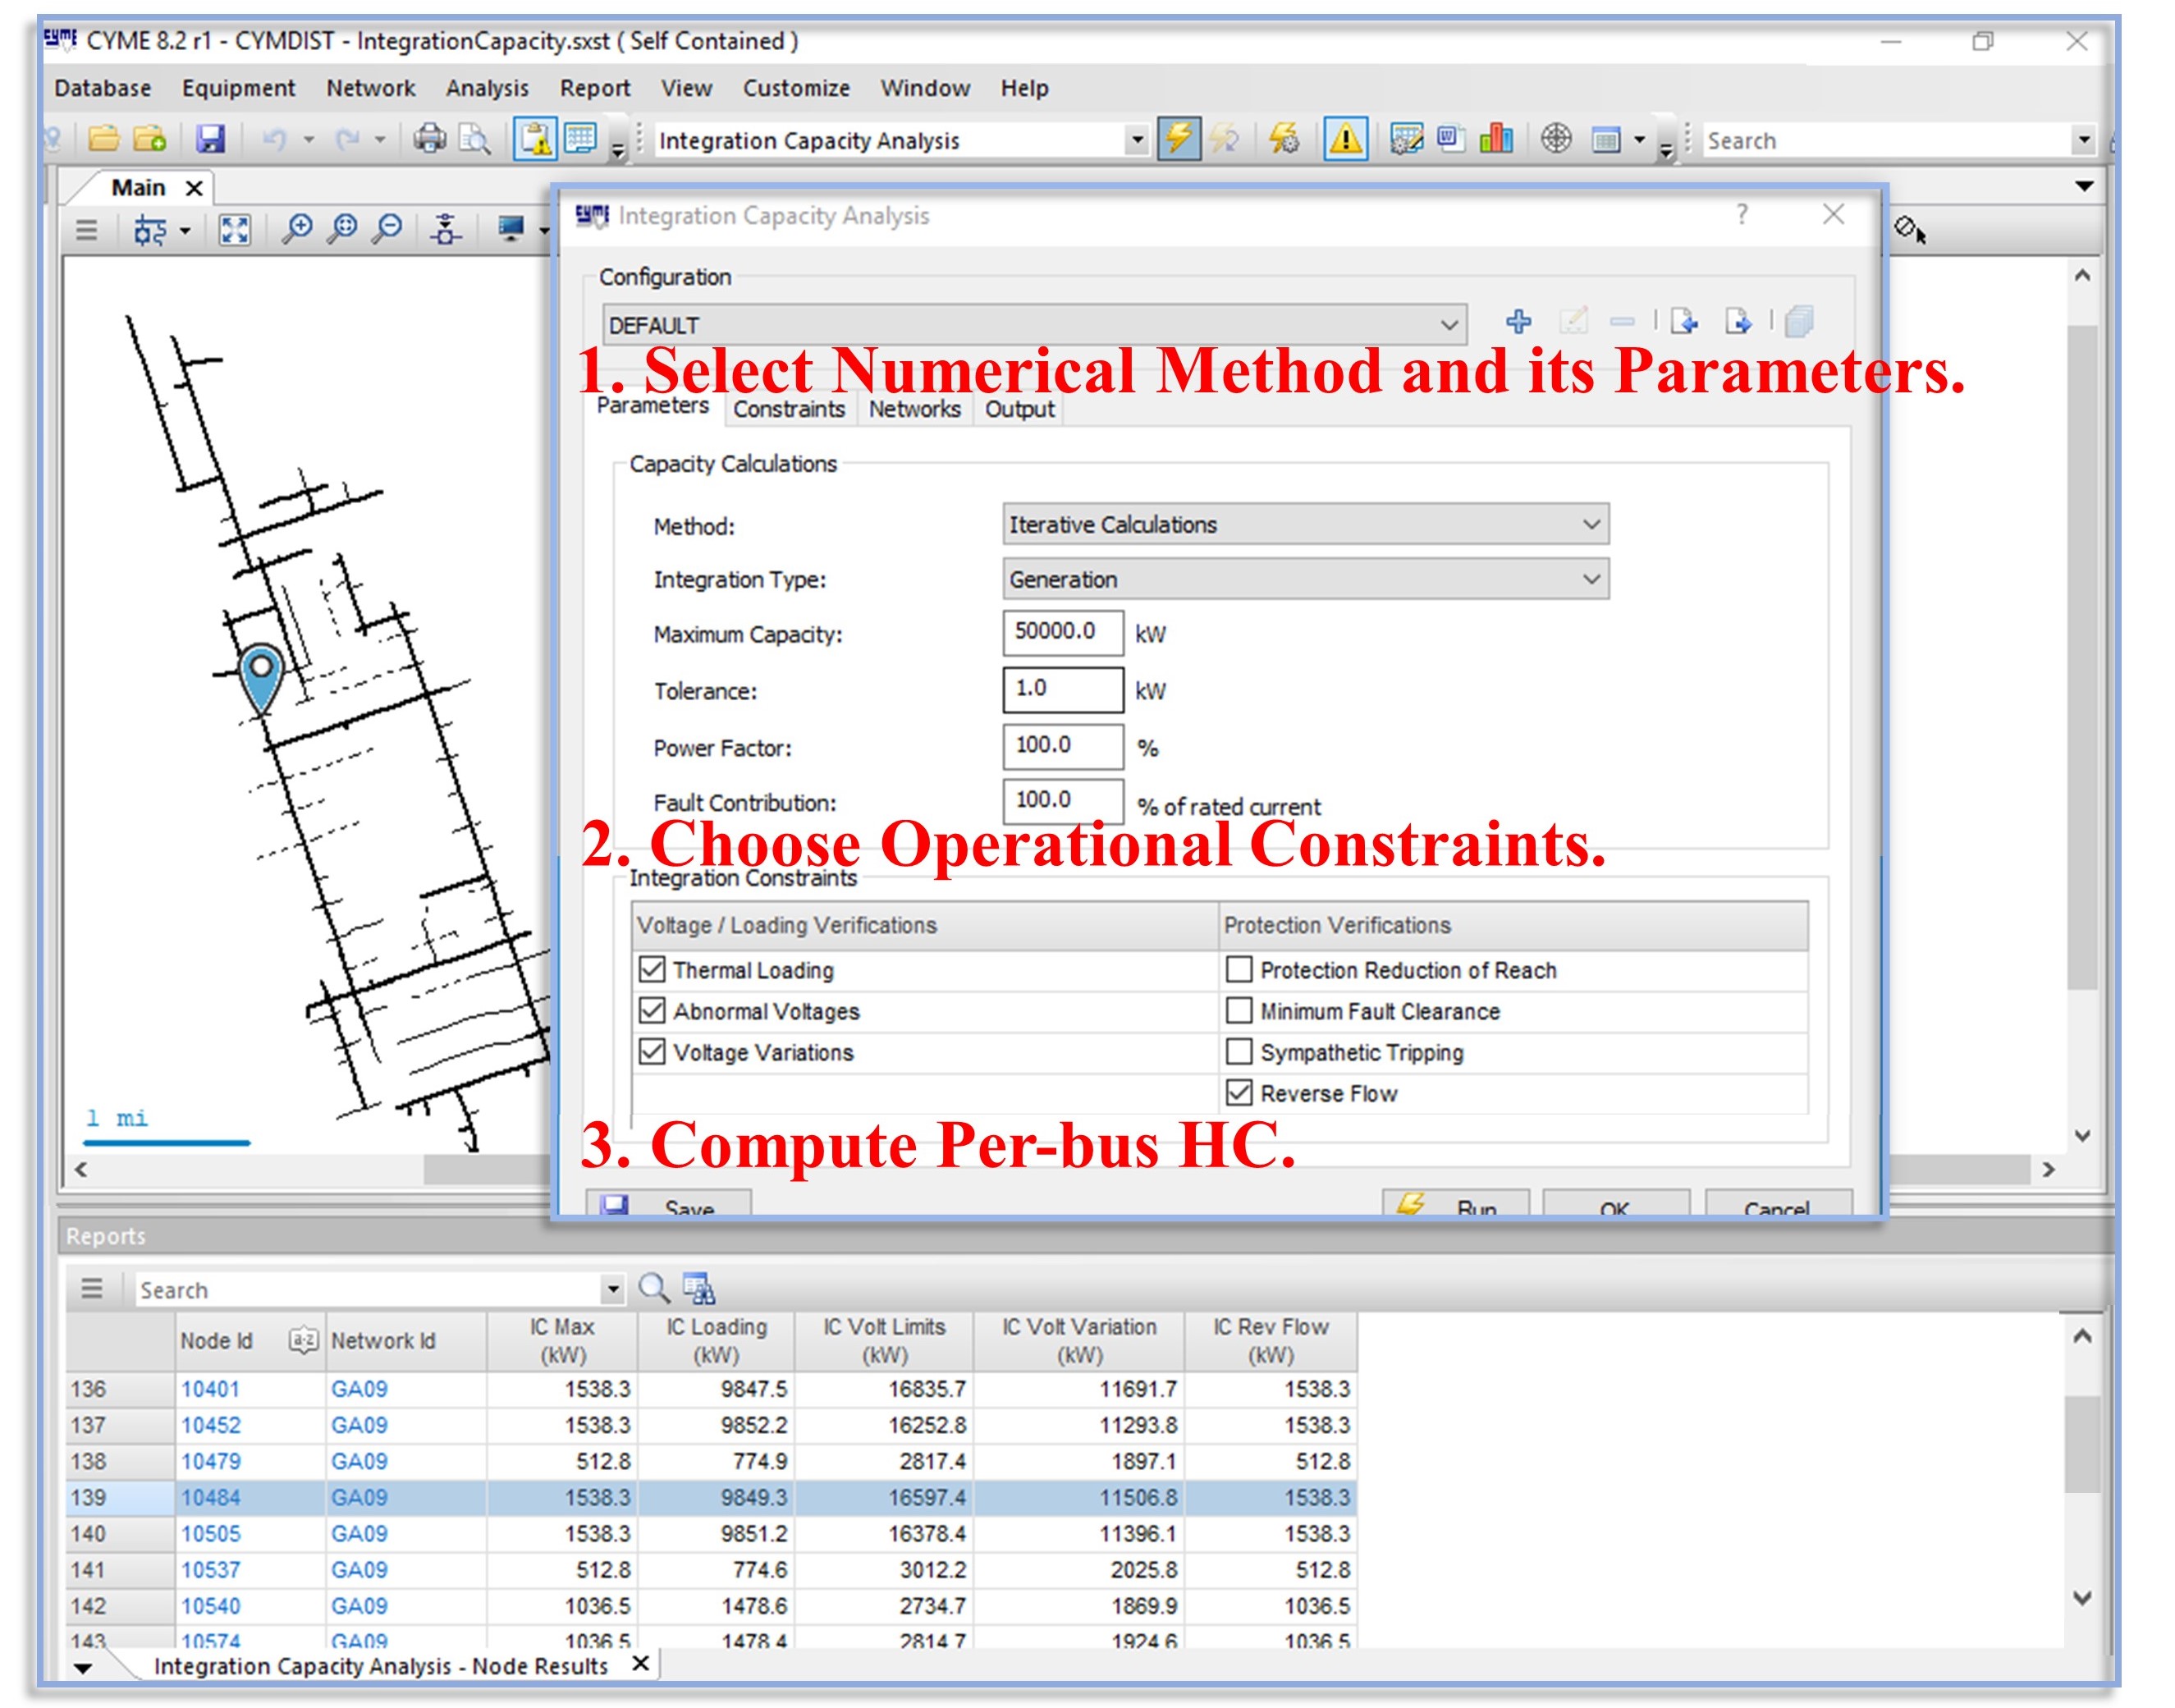
In addition to be a close partner with SEL southwest region, the lab is also a partner with CYME. We conduct various distribution grid analysis, such as topology analysis, hosting capacity analysis, virtual power flow analysis based on the data preprocessed by CYME.